Chapter 23 Exercises
Chapter 23 Exercises
23.1 Growth Models for Biological Populations
Question 23.31
1. (Spreadsheet helpful) For many years, China has been the world’s most populous country. However, India has been catching up, with 1282 million in mid-2015 and growing at 1.5% per year, versus China in mid-2015 with 1402 million and growing at only 0.5% per year. If these rates continue, when would India have more people than China?
1.
Late 2024
Question 23.32
2. The population of the less-developed countries (excluding China) in mid-2015 was 4.7 billion and expected to grow at 1.7% per year (this is an annual yield, so you may think of it as compounded annually). If this growth rate were to continue until mid-2025, what would the size of the population be then?
Question 23.33
3. If the growth rate of the less developed countries of Exercise 2 is actually 1.6% rather than 1.7%, what would the size of the population be in mid-2025?
3.
5.51 billion
Question 23.34
4. (Spreadsheet helpful) If the growth rate of the less developed countries of Exercise 2 can be reduced from 1.7% by 0.04% per year from 2015 through 2025, beginning in mid-2015, what would the size of the population be in mid-2025?
Question 23.35
5.
 An advertisement for Paul Kennedy’s book Preparing for the Twenty-First Century (Random House, 1993) asked: “By 2025, Africa’s population will be: 50%, 150% or 300% greater than Europe’s?” The population of 740 million in Europe in mid-2015 was expected to increase 1%—not per year, just 1%—by 2025. The population of 1166 million in Africa in mid-2015 was expected to increase at about 2.6% per year. Which answer would you give to the question?
5.
84% greater than Europe’s population
Question 23.36
6. Similar to the rule of 72 used in banking and explained in Exercise 11 in Chapter 21, the rule of 69 says that if a country’s population continues to grow at a constant rate of r% per year, then it will double in size every 69/r years. Apply the rule of 69 to estimate the doubling times for the following populations (figures are for mid-2015).
- Africa, 1166 million, 2.6%
- United States, 321 million, 0.77%
Question 23.37
7. Do the calculations as in Exercise 6 for:
- China, 1.402 billion, 0.5%
- The world as a whole, 7.309 billion, 1.2%
7.
(a) 138 years
(b) 58 years
Question 23.38
8. Wisconsin’s electricity demand increased 3.03% per year over the 35 years from 1970 to 2005. If that trend continued, when would Wisconsin need to have twice as much generating capacity as it did in 2005?

Is Warren Sanderson right about world population growth slowing down (see Spotlight 23.2, page 947)? How much difference does it make in projections if we look at the world as a whole or break it down by countries or regions? In Exercises 9 and 10, we investigate this question, first projecting as a whole and then projecting by regions and adding.
Question 23.39
![]() 9. The world population of 7.309 billion in mid-2015 was expected to increase 1.2% per year.
9. The world population of 7.309 billion in mid-2015 was expected to increase 1.2% per year.
- Project the population to mid-2035 (by then you may have finished having children, if you have any) and to mid-2050 (by then you may be thinking about retiring).
- What are the assumptions involved in your projections?
9.
(a) 2035: 9.3 billion; 2050: 11.1 billion
(b) No change in growth rate, no change in death rates, no global catastrophes, etc.
Question 23.40
![]() 10. Divide the countries of the world into three groups with differing rates of increase (see the accompanying table). (Why is this useful?)
10. Divide the countries of the world into three groups with differing rates of increase (see the accompanying table). (Why is this useful?)
- Redo the projections in Exercise 9a for the years 2035 and 2050 by projecting each group separately and adding the totals. Is there a major difference from the results in Exercise 9a?
Group Population
Mid-2015 (billions)Rate
of Growth (%)More developed countries 1.25 0.1 Less developed countries (excluding China) 4.70 1.7 China 1.40 0.5 - Will the world be able to support the numbers of people that you project? What problems could these greater numbers of people cause? What could be done to avert those problems? Do you think that anything will be done before there is some kind of worldwide crisis?
(In mid-1995, the world population was 5.7 billion and growing at 1.5% per year. Those figures led to projections, as in Exercise 9, of 8.3 billion for 2020 and 11.1 billion for 2040. The corresponding growth rates for the groups of Exercise 10 were 0.2%, 2.2%, and 1.1%, which led to projections of 8.9 billion for 2020 and 12.7 billion for 2040.)
23.2 How Long Can a Nonrenewable Resource Last?
Question 23.41
11. At the start of 2015, world oil proved reserves (including oil sands suitable for fracking) totaled 1326 billion barrels, while daily consumption was 93 million barrels. The U.S. Energy Information Administration (EIA) projected in 2010 that world consumption would increase 1.0% per year through 2035.
- What was the static reserve for oil at the start of 2015?
- What was the exponential reserve for oil at the start of 2015?
 What considerations may affect the answers to parts (a) and (b) over time?
11.
(a) 14 years
(b) 13 years
(c) Answers will vary.
Question 23.42
12. At the start of 2010, world natural gas proved reserves totaled 6609 trillion cubic feet, while annual consumption was 119 trillion cubic feet in 2011. The EIA projected in 2010 that world consumption would increase 1.0% per year through 2035.
- What was the static reserve for natural gas at the start of 2010?
- What was the exponential reserve for natural gas at the start of 2010?
- What considerations may affect the answers to parts and (b) over time?
Question 23.43
13. In his State of the Union address in January 2012, President Barack Obama said, “We have a supply of natural gas that can last America nearly one hundred years.” The U.S. Energy Information Administration had stated in October 2011 that the United States has 2543 trillion cubic feet (Tcf) of “potential” natural gas resources (including both identified and undiscovered resources). (One-third of that total was gas from shale, extractable by fracking.) In 2010, U.S. consumption of natural gas was 23.8 Tcf and projected to increase at 0.6% per year.
- What was the static reserve for natural gas in 2011?
- What was the exponential reserve then?
13.
(a) 107 years
(b) 83 years
Question 23.44
14. In an update to its 2011 report noted in Exercise 13, in 2014 the Energy Information Administration estimated the United States had 1932 Tcf of “technically recoverable dry natural gas resources,” consumption in 2012 was 25.6 Tcf, and growth in consumption was projected to be 0.8% per year from 2012 to 2040. (Actual reserves amounted to just 308 Tcf.)
- What was the static reserve for natural gas “resources” in 2014?
- What was the exponential reserve then?
Question 23.45
15. Not just the chrome trim on your car, but stainless steel and superalloys also require the metal chromium. In The Limits to Growth in 1972, author Donella H. Meadows and colleagues noted that the world reserves of chromium were 775 million tons, with consumption of 1.85 million tons and consumption growing at 2.6% per year.
- What was the static reserve for chromium in 1972?
- What was the exponential reserve then?
15.
(a) 419 years
(b) 96 years
Question 23.46
16. In 2013, world reserves of chromium were about 880 million tons, with consumption of 26 million tons and consumption growing at 4% per year.
- What was the static reserve for chromium in 2013?
- What was the exponential reserve then?
Question 23.47
17. Can our energy problems be solved by increasing the supply? [Thanks for the idea to Evar D. Nering of Arizona State University, The mirage of a growing fuel supply, New York Times (June 4, 2001), op-ed page.]
- Suppose that we have a 100-year “supply” of a resource (such as oil, for which known world reserves will last less than 100 years at the current world rate of use). That is, the resource would last 100 years at the current rate of consumption. Suppose that the resource is consumed at a rate that increases 2.5% per year (this is the average increase in consumption for oil in the United States since 1973). How long would the resource last?
- Suppose that we greatly underestimated the supply and actually have a 1000-year supply at the current rate of use. How long would that last if consumption increases 2.5% per year?
- Let’s think big and suppose that there is 100 times as much of the resource as we thought—a 10,000-year static reserve. How long would that last if consumption increases 2.5% per year?
17.
(a) 51 years
(b) 131 years
(c) 224 years
Question 23.48
18. We explore the consequences of reducing the rate of growth of oil use. Suppose that we halve the growth rate from the 2.5% per year given in Exercise 17 to 1.25% per year. [Thanks for the idea to Evar D. Nering of Arizona State University, The mirage of a growing fuel supply, New York Times (June 4, 2001), op-ed page.]
- How long would the 100-year static reserve last?
- How long would the 1000-year static reserve last?
- How long would the 10,000-year supply last?
Question 23.49
19. We continue the ideas of Exercises 17 and 18, but with a more radical hypothesis.
- How long would the 100-year supply last if we reduced our consumption by just 0.5% per year—that is, if we used 0.5% less each year instead of 2.5% more?
- How long would it last if we used 1% less each year?
19.
(a) 139 years
(b) Forever!
Question 23.50
20. By the time there is concern about using up a nonrenewable resource, it may be too late. Suppose that a resource has a static reserve of 10,000 years, but consumption is growing at 3.5% per year.
- How long would the resource last?
- How long before half the resource would be gone?
- How long to use up the second half?
- How much longer would the resource last if after half of it is gone, consumption is stabilized at the then- current level?
-
What implications do you see to your answers?
Question 23.51
21. Do a calculation to criticize the claim in the following quotation: “The United States holds 437 billion tons of known (coal) reserves, enough energy to keep 100 million large electric generating plants going for the next 800 years or so.” [Forbes (December 15, 1975), p. 28; thanks to Albert A. Bartlett.]
21.
That’s about 5.5 tons/plant/year ≈30 lb/plant/day, which is unreasonable.
For Exercises 22-24, refer to the following. The formula for the average growth rate over a period of time is even simpler than the one for the exponential reserve of a resource. If usage at the beginning is N0 and at the end of an interval of t years it is N, then the average annual rate of growth is
1tln
Question 23.52
22. The U.S. population was 63 million in 1890 and 321 million in 2015 (at roughly the same times of the year). What was the average annual rate of growth, to two decimal places?
Question 23.53
23. The U.S. population was 3.9 million in 1790 and 63 million in 1890. What was the average annual rate of growth, to two decimal places?
23.
2.78%.
Question 23.54
24. The average annual increase in oil consumption in the United States during 1993-2004 was nearly 2%. In fact, consumption in 1993 was 6.291 billion barrels and consumption in 2004 was 7.588 billion barrels. What is a more accurate (two-decimal-place) estimate of the average annual percentage increase in oil consumption? (From 2004 through 2007, growth was zero, due to much higher prices for oil; and growth was again zero from 2008 to 2011, due to the world recession.)
23.3 Radioactive Decay
Question 23.55
25. The carbon-14 in a carbon sample is decaying at approximately 6.5 atoms per hour per gram of carbon. Determine the approximate age of the sample.
25.
6.5 atoms per hour is one-fourth of 26 atoms per hour, so the sample is two half-lives (of 5730 years each) older than the sample in the text example and Table 23.1 (page 958): years. Using the formula ln gives 40,253 years, which again—given the imprecision of the data of 6.5 atoms per hour—should be rounded to 40,000 years.
Question 23.56
26. The “Ice Man” is the popular name for the body of a man that was found in 1991 preserved in a glacier in the Tyrolean Alps. Carbon-14 dating revealed that he had died about 5200 years ago. About how many atoms of carbon-14 are breaking down today per hour per gram of carbon in his tissue?
Question 23.57
27. (Contributed by John Oprea of Cleveland State University.) The Nuclear Test-Ban Treaty of 1963 brought an end to atmospheric testing of nuclear weapons (except by France and China). Testing had released into the atmosphere the radioactive isotope strontium-90. Just as with iodine-131, it settled out of the air onto grass in fields, was eaten by cows, and wound up in children’s milk. In the body, strontium-90 mimics calcium and is absorbed into the bones, where its radiation can cause cancer; its half-life is 28.8 years. Assuming that none of the strontium-90 absorbed into the bones of children in 1962 has been otherwise excreted, approximately what proportion will still remain 58 years later, in 2020?
27.
Two half-lives have passed, so about one-fourth of the strontium-90 remains.
Question 23.58
28. After one week, what percentage of a supply of molybdenum-99 (with a half-life of 66 hr) remains?
For Exercises 29–36, refer to the following. The physical half-life of a radioactive substance is unaffected by the biochemistry inside the human body. However, such a substance may not remain in the body for good but instead be excreted at some rate, thereby reducing the radiation exposure. The rate of excretion can be expressed in the form of a biological half-life. Let the physical half-life be and the biological half-life be . Then a combined effective half-life can be calculated from
The two paths for eliminating the radioisotope act in parallel. In mathematical terms, is one-half the harmonic mean of the two half-lives (Chapter 19, Exercise 16). Sometimes physical decay is the dominant influence (Exercises 29–31) and sometimes biological clearing is (Exercise 32).
Question 23.59
29. Iodine-131 actually has benign uses; it is used in treating thyroid cancer, hyperthyroidism, and non-Hodgkins lymphoma. Its physical half-life is 8 days; its biological halflife is 138 days. What is its effective half-life in the body?
29.
7.6 days
Question 23.60
30. Apart from uranium itself, the four major radioactive isotopes present in reactors and their waste are iodine-131, strontium-90, strontium-89, and cesium-137. Of the four, the isotope with the longest physical half-life is cesium-137, at 30 years. Found in high levels in water near the ruined Japanese Fukushima reactors in 2011, it is absorbed by ocean plants and moves up the food chain with increasing concentrations. Its biological half-life is 70 days. What is its effective half-life in the body?
Question 23.61
31. Technetium-99m has a physical half-life of 0.25 days and a biological half-life of 1 day. What is its effective half-life in the body?
31.
Question 23.62
32. Phosphorus-32 is used to treat excess production of red blood cells in bone marrow. It has a physical half-life of 14.3 days and a biological half-life of 1155 days. What is its effective half-life in the body?
Question 23.63
33. The physical half-life of carbon-14 is 5730 years, while its biological half-life is 40 days. The relatively short biological half-life explains why over a lifetime the proportion of carbon-14 in a body equilibrates (becomes equal) to the level in the atmosphere. What is the effective half-life of carbon-14 in the body?
33.
40 days
Question 23.64
34. In Exercise 27, we asked what proportion of strontium-90 remains in the body after 58 years, assuming no biological clearing and asking you to apply the physical half-life of 28.8 years. However, strontium-90 is indeed cleared from the body, with a biological half-life of about 50 years. Based on the effective half-life, give a different answer to what proportion of strontium-90 remains in the body after 58 years.
Question 23.65
35. Reinterpret the formula involving in terms of decay constants and explain why the formula makes sense.
35.
Answers will vary.
Question 23.66
36. Joe can split a cord of wood in 1 hour and Sam can split a cord in 2 hours. Explain why the amount of time that it would take both of them working together to split a cord is one-half the harmonic mean of 1 and 2. Hint: Consider first the case where it takes each of them separately 1 hour (Chapter 19, Exercise 16).
23.4 Harvesting Renewable Resources
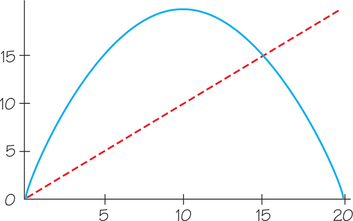
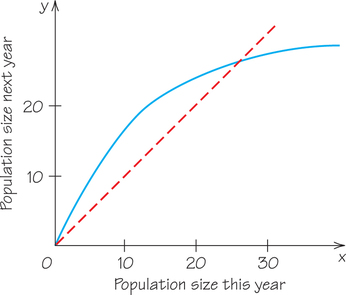
For Exercises 37–41, refer to the following. We suppose that a population has the reproduction curve shown in the accompanying figure, with units of thousands of tons of biomass. The mathematical description is that the population in the following year, , depends on the population in the current year (after any harvest) according to
for between 0 and 10, in units of millions of pounds. We start with a population this year whose value we can vary. (For these exercises, a spreadsheet or a programmable calculator is useful.)
Question 23.67
37. Start with . Calculate numerically the population in the first few years, draw a cobweb diagram, and briefly describe the qualitative behavior of the population.
37.
After the first year, the population stays at 15.
Question 23.68
38. Repeat Exercise 37 with the starting value .
Question 23.69
39. Repeat Exercise 37 with the starting value , going at least as far as .
39.
We calculate with all digits but report the numbers rounded to 1 decimal place: 7, 18.2, 6.6, 17.6, 8.4, 19.5, 2.0, 7.3, 18.6, 5.3.
Question 23.70
40. Try to find a starting value (besides 0, 5, 10, and 15) that leads to a stable population over time.
Question 23.71
41. What is the equilibrium population size?
41.
We must have , or . The only solutions are and , or .
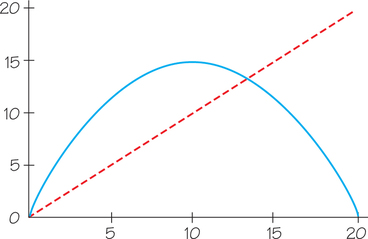
For Exercises 42–52, refer to the following. We suppose that the population has the reproduction curve shown in the following figure, with units of thousands of tons of biomass, whose mathematical description is
Question 23.72
42. Start with . Calculate numerically a population in the first 10 years, draw a cobweb diagram, and briefly describe the qualitative behavior of the population.
Question 23.73
43. Repeat Exercise 42 with the starting value .
43.
We calculate with all digits but report the numbers rounded to 1 decimal place: 10, 15.0, 11.3, 14.8, 11.6, 14.6, 11.8, 14.5, 11.9, 14.4. The population is oscillating but slowly converging to .
Question 23.74
44. Try to find a starting value (besides 0 and 20) that leads to extinction of the population.
Question 23.75
45. What is the equilibrium population size?
45.
Question 23.76
![]() 46. Which of the reproduction curves—the one for Exercises 37–41 or the one for Exercises 42–45—seems to you more realistic as a model of a biological population, and why?
46. Which of the reproduction curves—the one for Exercises 37–41 or the one for Exercises 42–45—seems to you more realistic as a model of a biological population, and why?
Question 23.77
47. What is the significance of the red dashed line in the preceding figures and its intersection with the blue curve?
47.
The red dashed line indicates the same size population next year as this year; where it intersects the blue curve is the equilibrium population size.
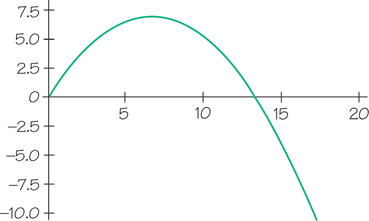
Question 23.78
48. The following figure shows the annual population gain in the absence of any harvesting. Determine the maximum sustainable yield to one decimal point.
Question 23.79
49. Suppose that the population of Exercises 42–48 starts with and each year we harvest half of the population. For example, in year 1, we harvest 5.5 million pounds, leaving the remaining 5.5 million pounds to reproduce (according to the reproduction curve) for the next year. Calculate numerically the population in the first 10 years, draw a cobweb diagram, and briefly describe the qualitative behavior of the population.
49.
The population sizes are 11, 12.0, 12.6, 12.9, 13.1, 13.2, 13.3, 13.3, 13.3, 13.3.
Question 23.80
50. Repeat Exercise 49 for a starting population .
Question 23.81
51. Harvesting a set proportion of a population is unrealistic for some situations, such as fishing, in which we can’t know the size of the population or when we have harvested half of it. A more realistic situation for fishing is that increasing harvests attract increasing fishing effort (e.g., more boats). Repeat Exercise 49 with and a harvesting strategy that harvests 1 million tons the first year and every year harvests an extra 1 million tons (over the harvest of the previous year).
51.
The population sizes are 11, 15.0, 13.7, 14.9, 14.9, 15.0, 14.8, 14.3, 13.0, 9.5—and the following year the population is wiped out.
Question 23.82
52. Suppose that the population of Exercises 42–51 has been overharvested to the point that only 1 million tons remain at the end of a particular year. If there is no harvesting at all until a year after a year with a population of 11 million tons, when can harvesting resume?
Question 23.83
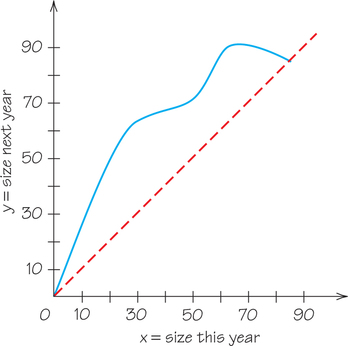
53. A reproduction curve for a population is shown in the following figure. Estimate the equilibrium population size and the maximum sustainable yield. (The units are in millions of pounds.)
53.
Equilibrium population is about 85 million pounds. Maximum sustainable yield (greatest difference between line and curve) is about 35 million pounds, leaving a population of 25 million pounds to reproduce for next year.
Question 23.84
54. Suppose that a reproduction curve for a certain population is as in the following figure, where the units are in millions of pounds.
- Estimate the sustainable yields corresponding to a population of size 10 remaining after the harvest.
- Estimate the maximum sustainable yield.
23.5 Dynamical Systems and Chaos
Question 23.85
55. In doubling on a “Stone Age” calculator (see Example 12), both sequences and also the sequence in the Self Check question all end up in the same orbit of attraction, or loop.
- What happens if we start with 39?
- Can you find a starting value that is not “attracted” to the indicated orbit?
 Explain what you observe in parts (a) and (b) give a general argument about why every starting value must eventually lead to a repeating orbit.
55.
(a) The last entry shown for the first sequence is the fourth entry of the second sequence, so the first “joins” the second and they then both end up going through the same cycle (loop) of numbers over and over.
(b) 39, 78, 56, and we have “joined” the second sequence. However, an initial 00 stays 00 forever; and any other initial number ending in 0 “joins” the loop sequence 20, 40, 80, 60, 20, ….
(c) Regardless of the original number, after the second push of the key, we have a number divisible by 4 and all subsequent numbers are divisible by 4. There are 25 such numbers between 00 and 99. You can verify that an initial number either joins the self-loop 00 (the only such numbers are 00, 50, and 25); joins the loop 20, 40, 80, 60, 20, … (the only such numbers are the multiples of 5 other than 00, 50, and 25); or joins the big loop of the other 20 multiples of 4.
Question 23.86
![]() 56. What happens if you successively multiply by 3 on a “Stone Age” calculator? What are the orbits of attraction?
56. What happens if you successively multiply by 3 on a “Stone Age” calculator? What are the orbits of attraction?
Question 23.87
57. You saw in Figure 23.12 on page 966 that a logistic model can result in a stable value, produce cycling among several values, or result in chaos. Other dynamical systems can exhibit similar behavior. Here, we examine the system in which we start with a positive whole number and iterate the following function:
For example, we have .
- Calculate what happens as is applied repeatedly, starting with 133. What do you observe?
- Pick a number different from 133 and different from 1, and iterate repeatedly. What do you observe?
- Why did we exclude 1 in part (b)?
-
Try some other values. Can you offer a general conclusion? Can you offer an argument why your conclusion is correct?
57.
(a) 133, 19, 82, 68, 100, 1, 1, …. The sequence stabilizes at 1.
(b) Answers will vary.
(c) That would trivialize the exercise!
(d) For simplicity, limit consideration to 3-digit numbers. Then the largest value of for any 3-digit number is . For numbers between 1 and 243, the largest value of is . Thus, if we iterate over and over—say, 164 times—starting with any number between 1 and 163, we must eventually repeat a number, since there are only 163 potentially different results. And once a number repeats, we have a cycle. Thus, applying to any 3-digit number eventually produces a cycle. How many different cycles are there? That we leave you to work out. Hints: (1) There aren’t very many cycles. (2) There is symmetry in the problem, in that some pairs of numbers give the same result; for example, .
Question 23.88
58. The behavior of some very simple dynamical systems is still not completely known. Consider the system that starts with a positive whole number and gives as the next number
This iterative function system was devised by Lothar O. Collatz, later of the University of Hamburg, during his student days before World War II. It is sometimes called the “ problem” or the “Syracuse problem” (because it became popular in the Mathematics Department of Syracuse University), and the sequences generated are sometimes referred to as hailstone numbers.
- Start with . What happens?
- Start with . What happens?
- Start with . What happens?
What you observe is known to happen for all , but after more than 60 years, mathematicians have been unable to show that it happens for every whatsoever.
Question 23.89
59. (Requires programmable calculator, spreadsheet, or BASIC programming) A population model slightly different from the logistic model is given by the iterative function system
where is a fraction of the limiting population and is a growth rate.
- Set , start with , and calculate the first 20 values .
- In part (a), you should have found . Replace this value with the rounded-up value and continue on to calculate .
- Now replace with the rounded-down value and continue on to calculate .
59.
(a) 0.0397, 0.15407173, 0.545072626, 1.288978, 0.171519142, 0.59782012, 1.31911379, 0.0562715776, 0.215586839, 0.722914301, 1.32384194, 0.0376952973, 0.146518383, 0.521670621, 1.27026177, 0.240352173, 0.78810119, 1.2890943, 0.171084847, 0.596529312
(b) 0.723, 1.323813, 0.0378094231, 0.146949035, 0.523014083, 1.27142514, 0.236134903, 0.777260536, 1.29664032, 0.142732915, 0.509813606
(c) 0.722, 1.324148, 0.0364882223, 0.141958718, 0.507378039, 1.25721473, 0.287092278, 0.901103183, 1.16845189, 0.577968093
Question 23.90
60. A dynamical system expressed as an iterated functional system has an equilibrium point at a value if, once the system reaches , it always stays at that value. In terms of an equation, an equilibrium point exists at if . For the dynamical system of Exercise 59, find all equilibrium points.
Question 23.91
![]() 61. (Requires programmable calculator, spreadsheet, BASIC programming, or preferably the use of software listed in the Suggested Websites section) The behavior of the logistic population model increases from 0 to 4, the system changes from one behavior to another through the following possible states:
61. (Requires programmable calculator, spreadsheet, BASIC programming, or preferably the use of software listed in the Suggested Websites section) The behavior of the logistic population model increases from 0 to 4, the system changes from one behavior to another through the following possible states:
- The population simply dies out.
- The population tends toward a nonzero equilibrium point.
- The population oscillates between 2 points.
- The population oscillates between 4 points, then 8 points, then 16 points, and so on.
- The population oscillates between numbers of points that are not powers of 2, until at last the population oscillates between three values.
- The population behaves chaotically.
Explore what happens for various values of between 0 and 4, trying to identify where the shifts in the system’s behavior take place.
61.
Period 2 begins at , period 4 at , period 8 at 3.544, period 3 at , and chaotic behavior onsets at about 3.57.
Chapter Review
Question 23.92
62. The population of the U.S. in mid-2015 was 321 million, increasing at 0.77% per year. If that growth rate continues, what will the population be in 2050?
Question 23.93
63. (Spreadsheet helpful) In 2015, the United States had the third largest population, after China and India. The population of Nigeria was 184 million, increasing at 2.8% per year; and the population of the U.S. was 321 million, increasing at 0.77% per year. If those rates continue, in what year would the population of Nigeria
- reach the level of the 2015 U.S. population?
- surpass the population of the United States?
63.
(a) 2035
(b) 2043
Question 23.94
64. Indium is an element (atomic number 49) used in solar cells and in the screens of tablet computers and cell phones; refined indium costs about $600 per kilogram. The current world reserves are about 11,000 metric tonnes, with annual world consumption of about 770 metric tonnes.
- What is the static reserve of indium?
- World demand increased from 570 tonnes to 770 tonnes from 2008 to 2013. What was the average annual compounded rate of increase?
- Suppose that demand for indium increases at 6% per year for the foreseeable future. What is the corresponding exponential reserve?
Question 23.95
65. You are radioactive! So are bananas. Your body and bananas both contain potassium. (But you are fine because your body excretes it.) The half-life of potassium-40 is 1.25 billion years. (Fortunately, the biological half-life in you is only about two weeks.)
- What is the decay constant for potassium-40, in proportion per year? This is the tiny proportion that decays per year.
- What is the decay constant for potassium-40, in proportion per second? This is the very tiny proportion that decays per second.
- A typical banana contains about 450 mg of potassium, of which 0.0117% is radioactive potassium-40. Every 40 grams of potassium-40 is composed of atoms (i.e., Avogadro’s number of atoms) of potassium-40. How many decays per second of potassium-40 does a banana experience? [The dose of radiation from eating a banana is known as a banana equivalent dose (BED). The average daily exposure to radiation from all sources is about 100 BED, while a chest CT scan delivers 70,000 BED.]
65.
(a)
(b)
(c) 14/sec
Question 23.96
66. Suppose that a population has a reproduction curve with the mathematical description
Draw a cobweb diagram starting with and describe what happens to the population in the long run. What happens if you start with a different value?
Question 23.97
67. The world population of whooping cranes (Grus americana) was 15 in 1942. Thanks to intensive efforts to save the species, there were 600 in 2014. What was the average rate of growth in population over that period? (See Exercises 22–24.)
67.
5%