23.3 23.2 How Long Can a Nonrenewable Resource Last?
People use resources. Some resources are renewable, but others are not. In this section, we model depletion of nonrenewable resources. In the next, we treat renewable resources.
Nonrenewable Resource DEFINITION
A nonrenewable resource is one that does not tend to replenish itself.
Gasoline, coal, and natural gas are important examples, while lottery winnings and inheritances could be examples from personal affairs. There is no practical way to recover or reconstitute these resources after use. Some substances, such as aluminum or the sand used to make glass, are potentially recyclable, but to the extent that we do not recycle them, they, too, are nonrenewable.
For a nonrenewable resource, only a fixed supply S is available. Even without human population increases, we face dwindling nonrenewable resources. We are interested in this question: How long will the supply E of a resource last?
As long as the rate of use of the resource remains constant, the answer is easy. If we are using U units per year and continue using U units per year, then the supply will last S/U years.
The expression S/U is called the static reserve.
Static Reserve DEFINITION
The static reserve is how long the supply will last at a particular constant annual rate of use.
This kind of calculation is the basis for claims that at the current rate of consumption, U.S. coal reserves will last 250 years, or that the U.S. strategic reserve of gasoline (stored in underground salt domes in the South) will last 60 days.
However, the rate of use of resources tends to increase with population and with a higher standard of living. For example, projections for use of electric power often assume that use will increase by a fixed percentage each year—that is, geometrically or exponentially. This is the simplest situation (apart from constant usage) and one that we can easily model.
Suppose that U1=U is the rate of use of the resource in the first year (this year), and that usage increases r=0.05=5% each year. Then the usage in the second year is
U2=U1+0.05U1=1.05U
and usage in the third year is
U3=U2+0.05U2=1.05U2=1.05(1.05U)=(1.05)2U
This is just like compound interest. Generalizing, we see that usage in year i will be (1.05)i−1U. Total usage over the next five years, for example, will be
U+(1.05)1U+(1.05)2U+(1.05)3U+(1.05)4U
This situation should remind you of the accumulation of regular deposits plus interest (see Chapter 21). Here, the usage U corresponds to a deposit, and the increasing rate of use r corresponds to the annual interest rate. We may think of the situation as making regular withdrawals (with interest) from a fixed supply of the nonrenewable resource. The savings formula gives
A=d[(1+r)n−1r]
In the resource situation, A is the accumulated amount of the resource that has been used up at the end of n years, and U=d is the initial rate of use.
To find out how long the supply S will last, we set the supply S equal to the cumulative use A over n years and then determine what n has to be. We have
S=U[(1+r)n−1r]
We perform some algebra to isolate the term involving n, to get
(1+r)n=1+SUr
At this point, to isolate n, we have to take the natural logarithm of both sides:
ln[(1+r)n]=n
Doing this gives the final expression
which may look complicated but is quite easy to evaluate on a calculator. The expression for is called the exponential reserve.

Using Logarithms to Solve Equations
Exponential Reserve DEFINITION
The exponential reserve is how long the supply will last at an initial rate of use that is increasing by a proportion each year, namely
EXAMPLE 3![]() U.S. Coal Reserves
U.S. Coal Reserves
Coal accounts for 30% of U.S. energy use, including 40% of U.S. electricity. Proved reserves of U.S. coal would last about 250 years at the current rate of use, so the static reserve is 250 years. How long would the supply last if the rate of use increases 0.77% per year indefinitely, the current rate of growth of the U.S. population?
The corresponding exponential reserve is
That’s quite a difference!
Self Check 3
Actually, we will never run out of coal. Why not?
- We could import it, a rising price would reduce use, or we would find substitutes.
We must not take such projections as exact predictions. Estimates of supplies of a resource may underestimate how much is available, and previously unknown sources may be discovered or the technology improved to extract previously unavailable supplies. In addition, as supplies dwindle, the economic considerations of supply, demand, and price come into play. We will never completely run out of any resource. It will always be available “at a price.” In fact, climate scientists suggest that if we are to avoid severe global warming, we will have to leave two-thirds of Earth’s oil and gas resources in the ground.
What Are Reserves? Or, How Much Is Out There, Really? 23.3
23.3
There are different categories for existing amounts of nonrenewable resources, and the standard terminology reflects how certain we are about the estimates of the amounts.
The amounts are classified as either identified or undiscovered. For identified resources, we know the location, the quality, and the quantity, from geologic and engineering evidence. Undiscovered resources, however, may be hypothetical or based on speculative reasoning; and experts may disagree greatly about such amounts.
Of identified resources, the most important component is proved reserves, measured amounts that we know from geologic and engineering data and that can be recovered with current technology under current economic conditions. Probable reserves are further amounts, arrived at from sampling and projection from the data. Finally, there are inferred reserves, amounts about which we are less certain, since their estimates may or may not be based on samples or evidence.
We must not take such projections lightly, either, because we are discussing resources that, once used, are gone forever. In any projection, it is very important to examine the assumptions, because small differences in the rate of increase of use can make big differences in the exponential reserve (see Spotlight 23.3).
EXAMPLE 4![]() Using Up Retirement Savings
Using Up Retirement Savings
Suppose that you begin retirement with $1 million in savings, and you don’t trust banks or the stock market, so you keep it all under your mattress. Suppose it costs you $50,000 per year to live at your accustomed standard of living and there is no inflation. How long will your retirement nest egg last? How long will it last if inflation is constant at 2.35%, the average annual inflation over the past 20 years from 1995 to 2015?
The static reserve is . With inflation, it will cost you increasingly more per year to live, so you should realize that your savings will last only for the length of the exponential reserve, which is
You have a fine strategy if you expect to live just about 17 more years and plan to I die broke!
Self Check 4
Under those circumstances, how long would $2 million last?
- 28.5 years
In our examples so far, we have assumed that the resource is just sitting there, waiting to be used up. For many natural resources, however, we have to find and develop new sources. As doing that becomes more difficult and more costly, at some point the exponentially increasing demand outstrips the ability to meet that demand.
Such a situation is modeled well by the logistic model famously applied to oil by M. King Hubbert, director of Shell Oil Company’s research laboratory. Figure 23.5 shows data for cumulative U.S. oil production through 2013, compared with the logistic curve for the ultimate production of gigabarrels (240 billion barrels).
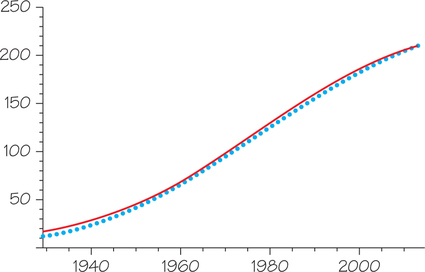
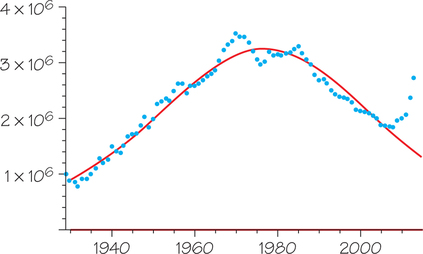
In 1956, Hubbert predicted that U.S. production would peak in the early 1970s (it did) and decline steadily thereafter. It has done that, too, except for a blip from the Prudhoe Bay oilfield in Alaska in the 1980s and now a big bump from fracking (fracturing rock to release oil and natural gas) in the past few years. See Figure 23.6 (the curve is similar to but “heavier in the tails” than the normal distribution curve of Chapter 5).
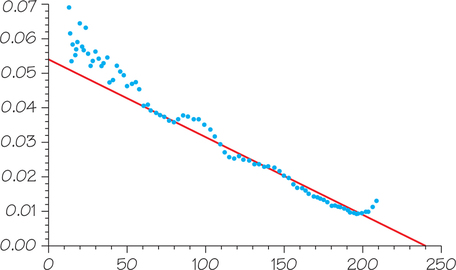
If we rearrange the logistic equation on page 948 by dividing both sides by and doing a little algebra, we get
Graphing a Line in Slope-Intercept Form
You can recognize this as the equation of a straight line , where
- takes the role of
- is
- is
- takes the role of
In other words, for a logistic model, if we graph against , we get a straight line. Figure 23.7 shows that the data fit the Hubbert model fairly well until the fracking era. Whether the “bump” from fracking will be just a blip or will add substantially to ultimate production remains to be seen. In any case, we cannot count on being able to find and exploit more and more large quantities of oil.
The world’s oil and gas are running out far faster than most people realize or than their governments are willing to acknowledge (see Exercises 11 and 12). The need for “affordable” fuels will likely soon dominate the political agendas of the entire world, particularly since experts have long predicted that world oil output would peak around 2006. In fact, production leveled off in 2005–2009 at about 85 million barrels per day, or 31 billion barrels per year.