3.6 3.5 Resolving Conflict via Coloring
In attempting to understand situations that involve scheduling, we might desire to achieve a wide variety of goals. For example, in certain types of scheduling problems, as we have seen here, we are interested in optimization issues. What is the earliest completion time for getting a collection of tasks done on two identical processors? However, in other situations, a different goal may arise. For example, in sports, consider a league of baseball teams. Each team has to play some games during the day, some at night, some at home, and some away from home. In the interests of equity, it may be desirable for each team to play the same number of day games and night games both at home and away against each of the other teams in the league. If, for example, team A plays 8 games away against team B and 2 games at home against B, then if A wins both home games but loses 7 out of 8 away games, it may appear that B had an advantage due to the way its games against A were scheduled.
Another goal of scheduling, other than optimization and equity, may be to prevent conflicts from occurring. We can use our knowledge of graph theory to solve some interesting scheduling problems where the goal is “conflict resolution.” For example, at most colleges, final examinations must be scheduled every semester and summer session. From the point of view of students as well as faculty, it would be desirable to schedule these examinations so that (1) no two examinations are scheduled at the same time when a student is enrolled in both courses and (2) the examinations are scheduled in as “compact” a way as possible—that is, in as few time slots or days as possible. The administration of the college may share the desire for these two features and want still another property for the scheduling: (3) No more than five examinations are scheduled for any time slot. The reason for the last condition might be that during the summer only five rooms with reliable enough air conditioning are available (or there might be only five rooms large enough to hold all the students taking the common final for multiple-section courses).

EXAMPLE 5![]() Scheduling Examinations
Scheduling Examinations
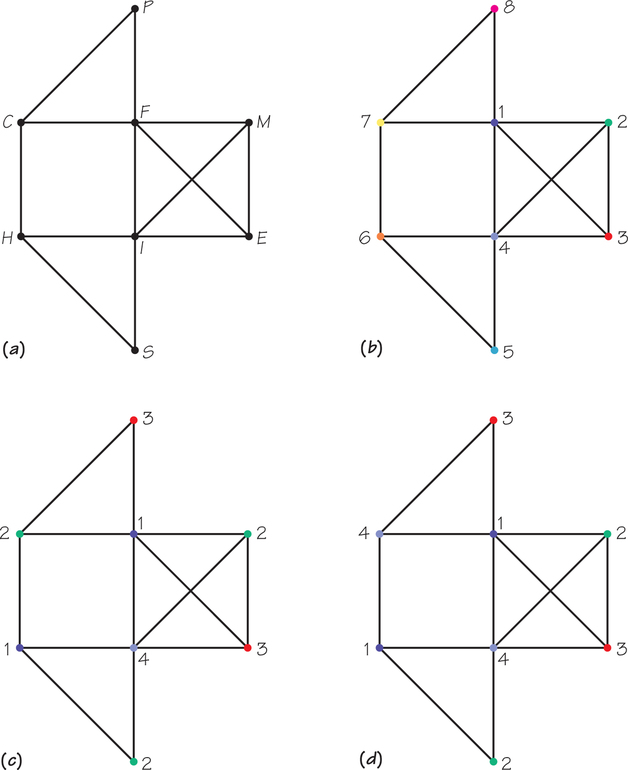
Small State is offering eight courses during its summer session. The table shows with an X which pairs of courses have one or more students in common. Only two air-conditioned lecture halls are available for use at any one time. To design an efficient way to schedule the final examinations, we can represent the information in this table by using a graph, as shown in Figure 3.22a. In the graph, courses are represented by vertices and two courses are joined by an edge if there is any student enrolled in both courses.
| F | M | H | P | E | I | S | C | |
| French (F) | X | X | X | X | X | |||
| Mathematics (M) | X | X | X | |||||
| History (H) | X | X | X | |||||
| Philosophy (P) | X | X | ||||||
| English (E) | X | X | X | |||||
| Italian (I) | X | X | X | X | X | |||
| Spanish (S) | X | X | ||||||
| Chemistry (C) | X | X | X |
We are faced with the following graph theory problem: Can we assign labels to the vertices of the graph in such a way that vertices that are joined by an edge get different labels? We think of the labels as the time slots the courses are assigned for final examinations. Traditionally, in graph theory such labels are referred to as colors. In this language, we seek to color the vertices of the graph so that vertices that are joined by an edge get different colors. Such a coloring is called a vertex coloring.
Vertex Coloring DEFINITION
The vertex coloring problem for a graph requires assigning each vertex of the graph a color (label) such that two vertices joined by an edge are assigned different colors.
Figure 3.22b shows one way to color the vertices of the graph so that each vertex gets a different color. Note that numbers are being used to represent the different colors. This solution is not very valuable, however, because it means that each course must be given its own time slot.
Can we improve upon eight colors? Note that F, M, I, E, and the edges that join them form a complete graph on four vertices. To have the vertices that are joined by an edge colored differently, we must assign F, M, I, and E four different colors because each of these four vertices is joined to the other three (see Figure 3.22c). Thus, any coloring of the graph in Figure 3.22a must use at least four colors. Exactly four colors will do, because the four colors used for F, M, I, and E can be used to color the remaining vertices while ensuring that no two vertices joined by an edge have the same color. The improved coloring in Figure 3.22c was found by trial and error.
Chromatic Number DEFINITION
The chromatic number is the minimum number of colors (labels) needed to label the vertices of a graph so that no two vertices of the graph joined by an edge get the same color.
The examination graph we have been studying has chromatic number 4; hence, we can schedule the eight examinations in four time slots without a conflict. Notice, however, that the coloring in Figure 3.22c schedules three different courses for the time slot corresponding to color 2. This means that not enough rooms with air conditioning will be available. Is there a way to recolor the graph with four colors so that each of the four colors is used only twice? Figure 3.22d shows that the answer is “yes.”
Thus, we are able to schedule the eight final examinations in four time slots, using only two air-conditioned rooms, and no student will have a conflict under this schedule!
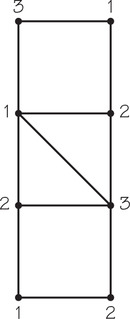
Self Check 4
What is the chromatic number of the graph shown on the right in Spotlight 3.2 on page 99? Show a coloring using the numbers 1, 2, 3, … as colors that achieve the chromatic number of colors.
The chromatic number for this graph is 3, as indicated by the coloring. There are other ways to color this graph with only three colors.
Realistic problems in scheduling government committees, high school and university final examinations, and job interviews (see Spotlight 3.3) are usually so large that graph coloring algorithms have to be incorporated into elaborate software packages to solve them.
Mathematicians have examined many kinds of coloring problems. Many developments about coloring graphs have been an outgrowth of work on the Four Color Problem (see Spotlight 3.4). We can study problems that involve the coloring of the edges of a graph rather than its vertices. Using techniques that have emerged from the study of coloring problems, problems involving such diverse contexts as scheduling government committees, using runways at airports efficiently, assigning frequencies for use by mobile pagers and cell phones, and designing timetables for public transportation have been solved—all these benefits from a problem that at first glance looks as if it belongs to recreational mathematics!
Scheduling Job Interviews 3.3
3.3
A group of companies is coming to campus for job interviews. Different companies may want different numbers of time slots to hold their interviews. In each time slot one student can be interviewed. In the example below, all the companies have requested contiguous time slots for the interviews, but this need not be the case. Due to the fact that classes are going on at the same time, five departmental conference rooms have been made available to the companies to conduct their interviews.
The interviews will follow the school’s regular hourly periods, which start at 9 A.M. and end at 4 P.M. (Companies will be scheduled for continuous interviews during lunch-hour times. Interviews cannot be scheduled beyond the end of the period that starts at 4 P.M. and ends at 5 P.M.)
| Company | Time Slot Requested |
|
|---|---|---|
| A | (Apricot Computers) | 7 |
| B | (Big Green) | 1 |
| C | (Challenge Insurance) | 4, 5 |
| D | (Daisy Printers) | 7, 8 |
| E | (Earnest Engine) | 4, 5, 6 |
| F | (Flexible Systems) | 2, 3 |
| G | (Gutter Leaders) | 1, 2 |
| H | (Halley’s Combs) | 6, 7 |
| I | (Indelible Ink Corporation) | 7, 8 |
| J | (Jay’s Produce) | 4, 5 |
| K | (Kelly’s Detective Agency) | 2, 3 |
| L | (Large Clothes) | 4, 5, 6 |
| M | (Metropolitan TV) | 1, 2 |
| N | (Nationwide Bank) | 4, 5, 6, 7 |
Look at the list of time blocks that the companies requested (where 1 = 9-10 A.M., … , 8 = 4-5 P.M.). Is it possible to accommodate all the companies that wish to do interviewing in the five rooms available while meeting their desired schedule times?
Problems of this kind seem simple enough, and you should try your hand at solving this particular one, for which a schedule does exist! However, this situation is not simple at all. The following facts are known about problems of this kind.
- Fact 1. Suppose there are i interviews, p time periods, and r rooms where interviews can be scheduled. Each interviewer has specified periods during which he or she wishes to conduct interviews. Is it possible to design a schedule that meets the desired specifications? It turns out that this problem is NP-complete (see Spotlight 2.1); that is, it belongs to a large group of problems for which, among other things, the fastest known algorithms run very slowly on large-problem versions.
- Fact 2. The problem just described remains NP-complete even for the case where there are only three rooms to be scheduled (p=3).
The moral is surprisingly simple: Scheduling problems are very hard to solve.
However, the situation is not always as hopeless as it might seem. If you look at the list of time requests for the corporations, you will note again that, not surprisingly, each company has requested a contiguous block of times. It turns out that when this condition holds, it is possible to determine whether there is a feasible schedule using an algorithm that works relatively quickly.
Four Color Problem 3.4
Many people perceive mathematics as complex because it often uses strange notations and algebraic symbols. Thus, it may come as a surprise that a problem that is relatively easy to state and understand without complex symbolism eluded solution for about 100 years. When it was finally solved, it set off a “firestorm,” with some saying that it had not truly been solved. More important, many of the ideas that have been developed in the theory of graphs were expanded or developed in the course of trying to prove this “guess.”
When a graph can be drawn on a flat piece of paper so that edges meet only at vertices, we can talk about not only the vertices and edges of the graph, but also about its regions or faces. Such graphs are known as plane graphs. Two examples of plane graphs are shown in the diagram below.
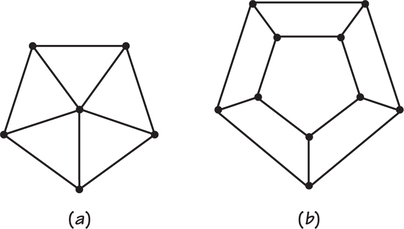
Graph (a) has 6 regions (the area “outside” the graph is counted as one of the 6 regions), 5 of which have 3 sides and 1 of which has 5 sides. Graph (b) has 7 regions, 2 of which have 5 sides and 5 of which have 4 sides. To count the number of sides of a region, imagine that you are a small ant and are following the edges around the region, starting at some vertex w. You count edges until you get back to w. Note that for each of these graphs, there is one unbounded (goes off to “infinity”) region, in addition to the other regions. When you color the regions of a plane map, do not forget to assign a color to the unbounded region.
If you think of the regions of a plane graph as being distinct countries on a page that is to appear in an atlas, it would be nice if countries that share a border got different colors so that they can be distinguished. Countries that meet at a vertex, but do not share an edge representing a common border, can be given the same color. It is convenient to use the term map for the regions created by the drawing of a plane graph.
The following provocative question was raised in a letter (1852) from Augustus De Morgan to William Rowan Hamilton that was based on a problem posed to De Morgan by his student Fredrick Guthrie, who heard the question from his brother Francis:
Can the regions of any (plane) map always be colored with four or fewer colors?
A clever approach to proving the “Four Color Conjecture” was suggested by Alfred Kempe. Kempe’s “proof” had a subtle error, which defied detection for many years, showing that proofs in mathematics really depend on the community of mathematicians to guarantee their accuracy. The British mathematician Percy Heawood discovered the error Kempe made. Heawood adapted Kempe’s proof to show correctly that any map can be colored with five or fewer colors. Approximately 100 years elapsed before a proof that the Four Color Conjecture was true was found. This occurred in 1976, but there was a curious loose end: The proof found by Wolfgang Haken and Kenneth Appel required that a computer verify a large collection of “calculations,” which were too numerous to be done by hand.
This proof troubled some philosophers and mathematicians, but it has been widely accepted by the mathematics community. In 1995, Neil Robertson, Daniel Sanders, Paul Seymour, and Robin Thomas found another proof. This proof, while simpler and shorter than the earlier Haken-Appel proof, also required computer calculations too numerous to be checked by “hand.” Though it is possible that some new approach to the Four Color Conjecture will avoid the use of computers, this is not widely thought to be likely. However, human ingenuity sometimes surprises us!