Skills Check
![]() Skill Check
Skill Check
Question 5.1
1. Here are the first rows of a dataset used for a student’s research project:
| Student ID | Gender | Scholarship Award |
High School Percentile |
Residency | First-year GPA |
|---|---|---|---|---|---|
| 10256 | Male | 2000 | 64 | Commuter | 2.81 |
| 10260 | Female | 4000 | 72 | On campus | 3.62 |
| 10349 | Female | 2000 | 65 | On campus | 2.35 |
| 10388 | Male | 6000 | 85 | On campus | 3.76 |
| 10394 | Female | 6000 | 87 | On campus | 3.53 |
| 10422 | Female | 2000 | 59 | On campus | 3.01 |
| 10597 | Male | 4000 | 75 | Commuter | 3.26 |
| 10600 | Male | 4000 | 78 | On campus | 3.42 |
Describe the individuals in these data.
1.
The students (identified by Student ID)
Question 5.2
2. The number of variables in Skills Check 1 is _______. Classify each as quantitative or qualitative.
Figure 5.7 (page 193) is a histogram of the annual tuition and fee charges for 64 four-year universities/colleges in Massachusetts. Skills Checks 3, 4, and 5 are based on this histogram.
2.
5; gender and residency are qualitative; scholarship award, high school percentile, and first-year GPA are quantitative.
Question 5.3
3. The number of universities/colleges with tuition and fee charges covered by the leftmost bar in the histogram is _______.
3.
8
Question 5.4
4. What is the relative frequency for the interval covered by the leftmost bar?
4.
8/64=0.125 or 12.5%
Question 5.5
5. What percentage of universities/colleges had tuition and fees of at least $40,000?
5.
37.5%
Question 5.6
6. The histogram below represents the number of job applications completed by recent college graduates before securing a job. This distribution is best described as _______-skewed.
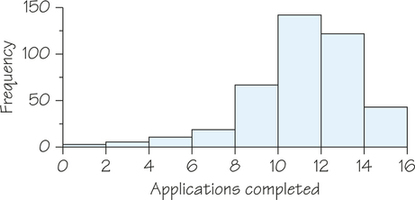
6.
left
Question 5.7
7. Brenner looks at real estate ads for houses in Sarasota, Florida. There are many houses ranging from $200,000 to $400,000 in price. A few houses on the coast, however, have prices of up to $15 million. The distribution of house prices will be
- skewed to the left.
- roughly symmetric.
- skewed to the right.
7.
c
Question 5.8
8. Here are foot lengths (in centimeters) of 15 randomly chosen soldiers:
| 27.2 | 28.0 | 26.2 | 25.7 | 32.8 |
| 25.0 | 26.3 | 28.0 | 27.4 | 25.8 |
| 26.9 | 26.8 | 27.3 | 29.0 | 28.8 |
In a stemplot of these measurements, the largest stem is _____.
8.
32
Question 5.9
9. For Figure 5.11 (page 195), interpret the meaning of 10|2.
- Ten states have a Hispanic population of 2%.
- Two states have a Hispanic population of 10%.
- One state has a Hispanic population of 10.2%.
9.
c
Question 5.10
10. The final (rightmost) digit of an observation would be called a ___________ in a stemplot.
10.
leaf
Question 5.12
12. The mean foot length of the 15 soldiers in Skills Check 8 is ________.
12.
ˉx≈27.41 cm
Question 5.13
13. The median foot length of the 15 soldiers in Skills Check 8 is _________.
13.
27.2 cm
Question 5.14
14. The mode of the foot length data in Skills Check 8 is _________.
14.
28.0 cm
Question 5.15
15. If a single-peaked distribution is skewed to the right, the median generally lies to the ___________ of the mean.
15.
left
Question 5.16
16. Between the first quartile and the third quartile lie ____% of the observations in a distribution.
16.
50%
Question 5.17
17. Which of these is greatest?
- The first quartile
- The third quartile
- The median
17.
b
Question 5.18
18. An outlier’s effect on the difference between the third quartile and the first quartile is _____ than its effect on the range.
18.
less
Question 5.19
19. In degrees Fahrenheit, a typical January day in Houston has a low of 46 and a high of 63, while in El Paso a typical January day has a low of 32 and high of 57. Which city has a larger temperature range for January?
- Houston, because 63>57 and 46>32
- El Paso, because 57−32>63−46
- El Paso, because 46−32>63−57
19.
b
Question 5.20
20. The first quartile of the dataset {1, 2, 3, 4, 5, 6} is _______.
20.
2
Question 5.21
21. Which of these measures is not in a five-number summary?
- Median
- Minimum
- Mean
21.
c
Question 5.22
22. Determine the five-number summary of the 15 soldiers’ foot lengths in Skills Check 8. (Remember to list the five numbers in increasing order.)
22.
25.0, 26.2, 27.2, 28.0, 32.8
Question 5.23
23. The standard deviation of the 10 blood pressures in Self Check 4 (page 195) is _______. (Support your answer by showing the calculations.)
- 13.23
- 13.95
- 194.6
23.
b
Question 5.24
24. You have data on the weights (measured in grams) of five crackers. The correct units for the standard deviation of these weights are _________________.
24.
grams
Question 5.25
25. What are all the values that a standard deviation s can possibly take?
- 0≤s
- 0≤s≤1
- −1≤s≤1
25.
a
Question 5.26
26. To specify the shape of a normal distribution completely, you must give its mean and its ___________________.
26.
standard deviation
Question 5.27
27. If two normal curves have the same mean but different standard deviations, the curve with the larger standard deviation will be ____________ the other curve.
- as tall as
- taller than
- shorter than
27.
c
Question 5.28
28. The steepest part of a normal curve is at the
- first and third quartiles.
- points at which the curvature changes.
- mean.
28.
b
Question 5.29
29. The scale of scores on an IQ test is approximately normal with a mean of 100 and a standard deviation of 15. The organization Mensa, which calls itself "the high-IQ society," requires an IQ score of 130 or higher for membership. What percentage of adults would qualify for membership?
- 95%
- 5%
- 2.5%
29.
c
Question 5.30
30. The length of human pregnancies from conception to birth varies according to a distribution that is approximately normal, with a mean of 266 days and a standard deviation of 16 days. We can expect that about _____% of all completed pregnancies are between 234 and 298 days.
30.
95%