Self Check Answers
![]() Self Check Answers
Self Check Answers
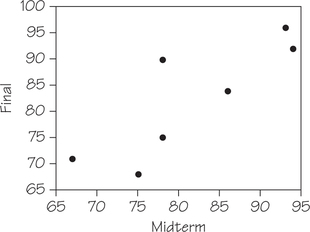
- Midterm exam scores can be used to explain final exam scores. Hence, Midterm is the explanatory variable. The midterm grade may help explain what a student might get on the final exam. Here's a scatterplot of these data.
- The scatterplot in Figure 6.3 (page 246) is an example of negative association. As the race number increases, the times tend to decrease. Figure 6.4 (page 246) provides an example of positive association. As IQ test scores increase, the reading test scores also tend to increase.
- (2, 0.023) (The second coordinate has been rounded to three decimal places.)
- For each additional year of age, cholesterol increases by 1.64 mg/dl.
Math SAT: ˉx=530, sx=61.2
Critical Reading: ˉy=506, sy|=55.9
r=15−1[(1.307)(0.787)+(−1.471)(−1.717)+(0.327)(0.250)+(−0.163)(0.608)+(0)(0.072)]r≈0.884
Page 275- Prediction for son’s height=0.516×(64)+33.73≈66.75 inches.
- This prediction indicates that the son is taller than his father but is still below average in height, which is 70 inches.
Student 1: BAC=−0.0127+0.01796(5)=0.0771; residual=0.10−0.0771≈0.02.
Student 14: BAC=−0.0127+0.01796(7)=0.11302; residual=0.09−0.11302≈−0.02.
TI-84-created scatterplot of Critical Reading SAT against Math SAT:
m=(0.928)(70.278.5)≈0.82988; b=486−0.82988(508)≈64.42096;∘y=0.83x+64.42
[Leave] [Close]