7.4 7.3 Simple Random Samples
In a voluntary response sample, people choose whether to respond. In a convenience sample, the interviewer makes the choice. In both cases, personal choice produces bias. The statistician’s remedy (pioneered by such people as George Gallup in the 1930s) is to allow impersonal chance to choose the sample. A sample chosen by chance allows neither favoritism by the sampler nor self-selection by respondents. Choosing a sample by chance avoids bias by giving all individuals an equal chance to be chosen. Any individual, whether rich or poor, young or old, black or white, and so on, has the same chance to be included in the sample.
The simplest way to use chance to select a sample is to place slips of paper with the names of all individuals in the population in a hat, shake the hat vigorously, and then draw out only a few names (the sample). This is the idea behind simple random sampling.
Simple Random Sample DEFINITION
A simple random sample (SRS) of size n consists of n individuals from the population chosen in such a way that every set of n individuals has an equal chance to be in the sample actually selected.
Picturing drawing names from a hat helps us understand what an SRS is. The same picture helps us see that an SRS is a better method of choosing samples than convenience or voluntary response sampling because it doesn’t favor any part of the population. But writing names on slips of paper and drawing them from a hat is a slow and inconvenient process, especially if, as in the CPS (Example 1), we must draw a sample of 50,000 participants from slips of paper representing all U.S. households. We can speed up the process by using a table of random digits. In practice, samplers use computers to do the work, but we can start doing it by hand for small samples from relatively small populations. Then we can move on to using technology to select the sample.
Table of Random Digits DEFINITION
A table of random digits is a list of the digits 0, 1, 2, 3, 4, 5, 6, 7, 8, 9 with these two properties:
- Each entry in the table is equally likely to be any of the ten digits 0 through 9.
- The entries are independent of one another. That is, knowledge of one part of the table gives no information about any other part.
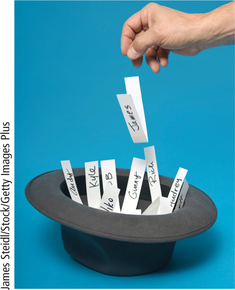
Table 7.1 is an excerpt from a table of random digits. (You can find longer tables on the Internet.) The digits in the table are displayed in groups of 5 to make the table easier to read, and the rows are numbered so we can refer to them, but the groups and row numbers are just for convenience. Table 7.1 in its entirety is one long string of 1000 randomly chosen digits. In order to use the table to select a sample, keep the following in mind:
- Each single entry in the table is equally likely to be any digit 0 through 9.
- Two consecutive digits from the table are equally likely to be any of the 100 possibilities 00 to 99.
- Three consecutive digits from the table are equally likely to be any of the 1000 possibilities 000 to 999.
| 101 | 19223 | 95034 | 05756 | 28713 | 96409 | 12531 | 42544 | 82853 |
| 102 | 73676 | 47150 | 99400 | 01927 | 27754 | 42648 | 82425 | 36290 |
| 103 | 45467 | 71709 | 77558 | 00095 | 32863 | 29485 | 82226 | 90056 |
| 104 | 52711 | 38889 | 93074 | 60227 | 40011 | 85848 | 48767 | 52573 |
| 105 | 95592 | 94007 | 69971 | 91481 | 60779 | 53791 | 17297 | 59335 |
| 106 | 68417 | 35013 | 15529 | 72765 | 85089 | 57067 | 50211 | 47487 |
| 107 | 82739 | 57890 | 20807 | 47511 | 81676 | 55300 | 94383 | 14893 |
| 108 | 60940 | 72024 | 17868 | 24943 | 61790 | 90656 | 87964 | 18883 |
| 109 | 36009 | 19365 | 15412 | 39638 | 85453 | 46816 | 83485 | 41979 |
| 110 | 38448 | 48789 | 18338 | 24697 | 39364 | 42006 | 76688 | 08708 |
| 111 | 81486 | 69487 | 60513 | 09297 | 00412 | 71238 | 27649 | 39950 |
| 112 | 59636 | 88804 | 04634 | 71197 | 19352 | 73089 | 84898 | 45785 |
| 113 | 62568 | 70206 | 40325 | 03699 | 71080 | 22553 | 11486 | 11776 |
| 114 | 45149 | 32992 | 75730 | 66280 | 03819 | 56202 | 02938 | 70915 |
| 115 | 61041 | 77684 | 94322 | 24709 | 73698 | 14526 | 31893 | 32592 |
| 116 | 14459 | 26056 | 31424 | 80371 | 65103 | 62253 | 50490 | 61181 |
| 117 | 38167 | 98532 | 62183 | 70632 | 23417 | 26185 | 41448 | 75532 |
| 118 | 73190 | 32533 | 04470 | 29669 | 84407 | 90785 | 65956 | 86382 |
| 119 | 95857 | 07118 | 87664 | 92099 | 58806 | 66979 | 98624 | 84826 |
| 120 | 35476 | 55972 | 39421 | 65850 | 04266 | 35435 | 43742 | 11937 |
| 121 | 71487 | 09984 | 29077 | 14863 | 61683 | 47052 | 62224 | 51025 |
| 122 | 13873 | 81598 | 95052 | 90908 | 73592 | 75186 | 87136 | 95761 |
| 123 | 54580 | 81507 | 27102 | 56027 | 55892 | 33063 | 41842 | 81868 |
| 124 | 71035 | 09001 | 43367 | 49497 | 72719 | 96758 | 27611 | 91596 |
| 125 | 96746 | 12149 | 37823 | 71868 | 18442 | 35119 | 62103 | 39244 |
Here is the procedure to use the random-digit table to choose a simple random sample.
Using a Table of Random Digits PROCEDURE
- Step 1. Label. Give each member of the population a numerical label of the same length. Up to 10 items can be labeled with one digit: 1, 2, … 9, 0. Up to 100 items can be labeled with two digits: 01, 02, …, 99, 00. Up to 1000 items can be labeled with three digits, and so on.
- Step 2. Pick a row from the table. Without looking at the table, pick a row (between line numbers 101 and 125, inclusive). From the row you picked, read successive groups of digits of the same length that you used as labels. Just skip over all groups of digits not used as labels or that duplicate a label already selected (unless you want to allow repeated values). If you run out of digits in a row before you have reached your sample size, continue to the next row (or repeat Step 2 and continue on another row from the table).
- Step 3. Stop. It is generally easiest to make a relatively long list of groups of digits of the desired length and then to cross out nonlabel groups and duplicates. Stop when you have identified sufficient labels for the sample size that you need.
- Step 4. Identify the individuals in your sample. Your sample contains the individuals corresponding to the labels you found in Steps 2 and 3.
EXAMPLE 4![]() Sampling Songs
Sampling Songs
Professor Lesser has all 27 songs from the album called The Beatles One stored on a digital media player and wants to play four randomly chosen songs to accompany his morning commute. Let’s follow the four-step procedure for using the random-digit table to choose a simple random sample of size 4 from the 27-song playlist.
- Step 1. Give each song a numerical label. Because two digits are needed to label the 27 songs, all the labels will have two digits. Table 7.2 lists the 27 songs with labels from 01 to 27.
Table 7.4: Table 7.2 Songs from The Beatles One Album, Assigned to Two-Digit Labels
01 Love Me Do 10 Help! 19 Hello, Goodbye 02 From Me to You 11 Yesterday 20 Lady Madonna 03 She Loves You 12 Day Tripper 21 Hey Jude 04 I Want to Hold Your Hand 13 We Can Work it out 22 Get Back 05 Can’t Buy Me Love 14 Paperback Writer 23 The Ballad of John and Yoko 06 A Hard Day’s Night 15 Yellow Submarine 24 Something 07 I Feel Fine 16 Eleanor Rigby 25 Come Together 08 Eight Days a Week 17 Penny Lane 26 Let it Be 09 Ticket to Ride 18 All You Need is Love 27 The Long and Winding Road - Step 2. We pick line 125 from Table 7.1. We begin writing two-digit groups as we read across line 125 of the table (since our song labels have two digits). We cross out any two-digit groups that are greater than our population size of 27 and any duplicates (18 is a duplicate):
96 74 61 21 49 37 82 37 18 68 18 44 23 51 19 62 10 33 92 44 - Step 3. We stop when we reach label 19 because we’ve identified 4 labels for our sample.
- Step 4. Corresponding to the selected labels shaded in Step 2, our media player will play the following song sequence: “Hey Jude,” “All You Need is Love,” “The Ballad of John and Yoko,” and “Hello, Goodbye.”
Self Check 3
Use the process outlined in Example 4 to select a simple random sample of 5 songs. Enter the random digits table, Table 7.1, on line 110.
- Students who had a class right before their math class might be more tired than those who did not. Because they had back-to-back classes, they might not have had enough time to eat before their math class. Students who did not have a class right before their math class would have had time both to eat and to study for the test before going to math class.

After using the random number table to select the random sample in Self Check 3, you are probably ready to turn to technology to generate random samples. When the population from which the sample is selected is relatively small (≤144), you could use the Simple Random Sample applet to select your sample (see Applet Exercise 1, page 338 for directions). Spotlight 7.1 outlines the steps for using a TI-84 calculator or Excel to select the sample.
Using Technology to Select an SRS 7.1
7.1
Graphing calculators and spreadsheet and statistical software have random number generators. Rather than using the random digits table, you can use technology to select the random sample. Below are instructions for completing Self Check 3 using a TI-84 graphing calculator or Excel.
TI-84 Instructions
Below are instructions on using a Ti-84 graphing calculator to select a sample of size 4 from the 27 songs listed in Table 7.2.
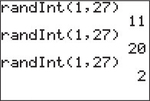
- Press MATH→PRB and then 5 (for randint().
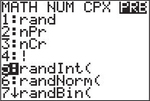
- Complete the command by pressing 1 , 27 ) .
- Press ENTER
repeatedly to generate a list of labels of the songs in the random sample. (if there are repeats in your sample, just skip over them.)
On newer Ti-84 Plus calculators, you can avoid the problem with repeats by using the command randint- NoRep instead.
- Press Math→PRB and then 8 (for randintNoRep(.
- Complete the command by pressing 1 , 27 ) .
This command will put the entire set of 27 labels in random order. So, start at the beginning of the output list and read off the first four labels for your sample.
Excel Instructions
In an empty cell in row 1, enter = RANDBETWEEN(1,27) and press ENTER. The label of the first song in the sample will appear. Select this cell, then click on the lower right corner of the selected cell, and drag down to row 5. The column will now contain the labels of the songs in the random sample. if there are repeats in your sample, click on the cell in row 5 and continue to drag down to randomly produce more label numbers until you have your desired sample size.
| Students | Rand |
|---|---|
| Joe | 0.305127 |
| Sally | 0.130861 |
| Kelly | 0.335956 |
| Bruce | 0.525466 |
| Marsha | 0.288252 |
| Caitlin | 0.036762 |
| George | 0.084562 |
| Jian | 0.763097 |
| Cheryl | 0.75338 |
| Ying | 0.77542 |
Using Rand to Select the Sample
Using randint on the Ti-84 or RANDBETWEEN on Excel to select a sample works really well when the sample size is small relative to the population size. Otherwise, eliminating duplicates becomes a time-consuming endeavor. An alternative is to use Rand, which generates an observation from the uniform distribution on the interval from 0 to 1 (see Chapter 5, Exercise 73, and Figure 5.37 on page 238).
Suppose you want to draw a random sample of 5 students from a class of 10 students:
- Step 1. Enter the students’ names (or label numbers) into a column of an Excel spreadsheet. Name the column Students (see Table 7.3).
- Step 2. Name the next column Rand. Then in this column, click on the cell in the row opposite the top name. Enter=RAND() and then press ENTER. Click to select this cell, then click the lower right corner of the cell, hold and drag down until you have reached the last name on the list. You now have a column of randomly drawn observations from the uniform distribution.
- Step 3. Highlight the columns Students and Rand. Click the Sort icon and select Custom Sort. in the “Sort by” drop-down menu, select Rand and click GK. Your results will be similar to Table 7.4.
| Subjects | Rand |
|---|---|
| Caitlin | 0.036762 |
| George | 0.084562 |
| Sally | 0.130861 |
| Marsha | 0.288252 |
| Joe | 0.305127 |
| Kelly | 0.335956 |
| Bruce | 0.525466 |
| Cheryl | 0.75338 |
| Jian | 0.763097 |
| Ying | 0.77542 |
If for some reason you need to expand your sample size, simply go to the next name or group of names on the list.
So although digital media players may have a “shuffle” option to put a playlist in a randomized order, after reading Example 4 and Spotlight 7.1, you are now familiar with a procedure for obtaining a random sample for any situation where you have an ordered list for the population.
Online polls and mall interviews produce samples. We can’t trust results from these samples because they are chosen in ways that invite bias. We have more confidence in results from an SRS because it uses impersonal chance to avoid bias. So, the first question to ask about any sample is whether it was chosen at random. Opinion polls and other sample surveys carried out by people who know what they are doing use random sampling. Most national sample surveys use sampling schemes that are more complex than SRS. For example, the monthly national sample from the Current Population Survey discussed in Example 1 is pieced together from many smaller samples. However, the big idea remains the deliberate use of chance to choose the sample.
EXAMPLE 5![]() The Plane Truth
The Plane Truth
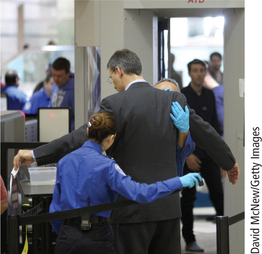
According to a USA Today Gallup poll conducted in 2010, 71% of people who had flown at least twice in the past year believed the potential loss of personal privacy from full-body scans or pat-downs was worth it as a method to prevent acts of terrorism. How much do we trust the quality of this survey? Ask first how the sample was selected. On the Gallup website, we learn that the results were based on telephone interviews with a randomly selected national sample of 3018 adults selected using random-digit-dial sampling conducted November 19–21, 2010.
It is a good start toward confidence in the poll to know the intended population, the sample size, the tight window of time (so that there is minimal influence from changes in current events), and—most importantly—random selection. in the next section, we address a few other important considerations.