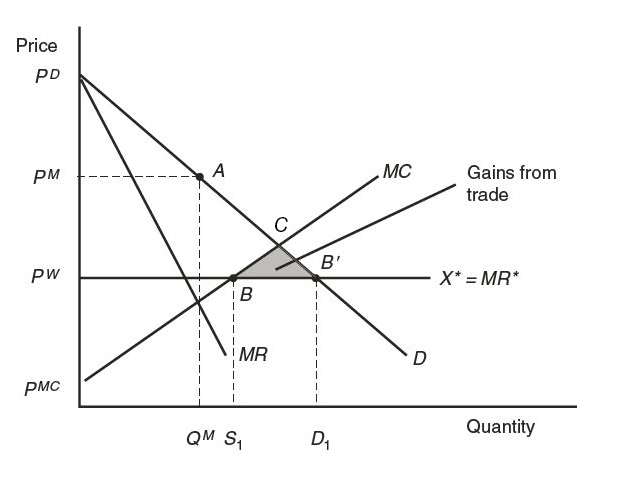
Figure 9-2 shows the free-trade equilibrium under perfect competition and under monopoly (both with the price PW ). In this problem, we compare the welfare of Home consumers in the no-trade situation and under free trade.
a. Under perfect competition, with the Price PW , label the triangle of consumer surplus and the triangle of producer surplus. Outline the area of total Home surplus (the sum of consumer surplus and producer surplus).

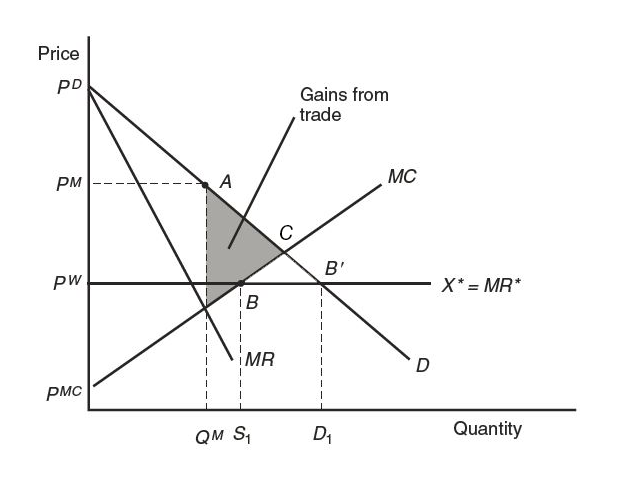
The figure is a 2d plot that shows the free-trade equilibrium under perfect competition and under monopoly. Both with the price, capital P sup W. The horizontal axis is labeled Quantity. The vertical axis is labeled Price. Four lines are shown on the plot. Two decreasing lines starting at the point P sub D are M R and D curves. Below them there is horizontal line corresponding to the marginal revenue, X star equals M R star. Below it, there is an increasing line starting at the point P sup M C and corresponding to M C curve. No-trade monopoly equilibrium occurs at the point A, when the quantity is Q sup M and the price is P sup M. Free trade equilibrium is achieved at the point B, where marginal revenue equals marginal costs. At this point, home firm supplies are S 1. The point B prime is the point where marginal revenue equals demand. At this point, home consumers demand is D 1.
- choose your answer
- PDB′BPMC
- PWBPMC
- PDB′PW
- choose your answer
- PDB′BPMC
- PWBPMC
- PDB′PW
- choose your answer
- PDB′PW
- PDB′BPMC
- PWBPMC
- Chapters
- descriptions off, selected
- captions settings, opens captions settings dialog
- captions off, selected
- English Captions
This is a modal window.
Beginning of dialog window. Escape will cancel and close the window.
End of dialog window.
This is a modal window. This modal can be closed by pressing the Escape key or activating the close button.
This is a modal window.
Work It Out, Chapter 9, Question 1
(Transcript of audio with descriptions. Transcript includes narrator headings and description headings of the visual content)
(Speaker)
This problem will ask you to compare the welfare of Home consumers in the no-trade situation and under free trade. In particular, this part of the question asks you to label the triangle of consumer surplus and the triangle of producer surplus, and outline the area of total Home surplus, which is the sum of consumer and producer surplus, under conditions of perfect competition with the price PW.
Let’s look at Figure 9-2 to begin and review the definitions of consumer surplus and producer surplus.
(Description)
A coordinate plane with the horizontal x-axis and the vertical y-axis is drawn.
The horizontal axis is labeled as Quantity, with points, Q superscript M, S subscript 1, and D subscript 1, indicated from left to right. The vertical axis is labeled as Price, with points, p superscript MC, p superscript W, p superscript M, and p superscript D, indicated from bottom to top.
A straight line sloping downward from the left upper corner at point, p superscript D, to the right lower corner of the plot is drawn. It is labeled D.
A straight line sloping downward from the left upper corner at point, p superscript D, to the right lower corner of the plot is drawn. It is labeled MR. The slope of line MR is greater than the slope of line D.
A straight line, parallel to the horizontal axis, which extends from point, p superscript W, on the vertical axis is drawn. It is labeled X star equals MR star.
A straight line sloping upward from the left lower corner at point, p superscript MC, to the right upper corner of the plot is drawn. It is labeled MC.
There are dotted lines drawn from point, p superscript M, on the vertical axis, which is parallel to the horizontal axis, as well as from points, Q superscript M, S subscript 1, and D subscript 1, on the horizontal axis, which are parallel to the vertical axis.
Point A with coordinates, Q superscript M and p superscript M, is plotted on line D. It is briefly labeled No-trade, monopoly equilibrium.
Point B, with coordinates, S subscript 1 and p superscript W, is plotted on the intersection of lines, MC and X star equals MR star. It is briefly labeled Free-trade equilibrium.
Point B prime, with coordinates, D subscript 1 and p superscript W, is plotted on the intersection of lines, D and X star equals MR star.
The region on the horizontal line between points, S subscript 1 and D subscript 1, is briefly labeled Imports, M subscript 1.
(Speaker)
Consumer surplus is the area of the triangle below the demand curve and above the equilibrium price. Producer surplus is the area of the triangle above the supply curve and below the equilibrium price.
We can now identify consumer and producer surplus as well as the area of total Home surplus.
(Description)
The triangular region is labeled Gains from trade and it has the following vertices.
The first vertex is point B.
The second vertex is point B prime.
The third vertex is a point of the intersection between lines, MC and D.
(Speaker)
Consumer surplus will be the area of the triangle described by PD, B prime, PW,
(Description)
The triangle with vertices, p superscript D, B prime, and P superscript W, is briefly shaded.
(Speaker)
producer surplus is the area of the triangle described by PW, B, PMC,
(Description)
The triangle with vertices, p superscript W, B, and P superscript MC, is briefly shaded.
(Speaker)
and the area of total Home surplus PD, B prime, BPMC.
(Description)
The triangle with vertices, B, B prime, and a point of the intersection between lines, MC and D, is briefly shaded.