Video transcript
Work It Out, Chapter 10, Question 1
(Transcript of audio with descriptions. Transcript includes narrator headings and description headings of the visual content)
(Speaker)
This problem will ask you to consider a large country with export subsidies in place for agriculture that changes its policy and decides to cut its subsidies in half. Are there gains or losses to the large country, or is the situation ambiguous? What is the impact on domestic prices for agriculture and on the world price?
(Description)
Two coordinate planes with the horizontal x-axis and the vertical y-axis are drawn.
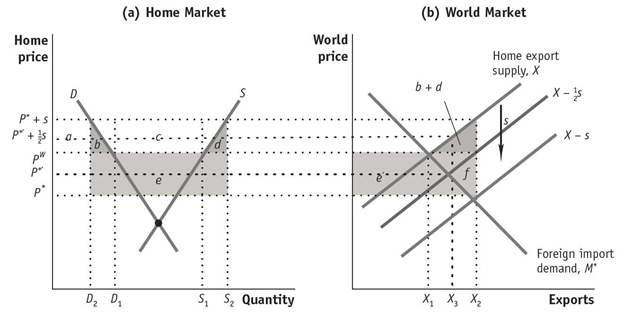
The left plane is labeled (a) Home Market.
The horizontal axis is labeled as Quantity, with points, D subscript 2, D subscript 1, S subscript 1, and S subscript 2, indicated from left to right. The vertical axis is labeled as Home Price, with points, p star, p star prime, p superscript W, p star prime plus one half times s, and p prime plus s, indicated from bottom to top.
A straight line sloping downward from the left upper corner to the right lower corner of the plot is drawn. It is labeled D.
Another straight line sloping upwards from the left lower corner to the right upper corner of the plot is drawn. It is labeled S.
Lines, S and D, intersect at point with the x-value located between points, D subscript 1 and S subscript 1, and with the y-value located between points, 0 and p star.
There are dotted lines drawn from points, D subscript 2, D subscript 1, S subscript 1, and S subscript 2, on the horizontal axis, which are parallel to the vertical axis, as well as from points, p star, p star prime, p superscript W, p star prime plus one half times s, and p prime plus s, on the vertical axis, which are parallel to the horizontal axis.
The area labeled a is a rectangle with the following vertices.
The first vertex is point with coordinates, 0 and p superscript W.
The second vertex is point with coordinates, 0 and p star plus s.
The third vertex is point with coordinates, D subscript 2 and p star plus s.
The fourth vertex is point with coordinates, D subscript 2 and p superscript W.
The area labeled b is a triangle with the following vertices.
The first vertex is point with coordinates, D subscript 2 and p star plus s.
The second vertex is point with coordinates, D subscript 2 and p superscript W.
The third vertex is point with coordinates, D subscript 1 and p superscript W.
The area labeled c is a trapezoid with the following vertices.
The first vertex is point with coordinates, S subscript 1 and p superscript W.
The second vertex is point with coordinates, S subscript 2 and p star plus s.
The third vertex is point with coordinates, D subscript 2 and p star plus s.
The fourth vertex is point with coordinates, D subscript 1 and p superscript W.
The area labeled d is a triangle with the following vertices.
The first vertex is point with coordinates, S subscript 2 and p star plus s.
The second vertex is point with coordinates, S subscript 1 and p superscript W.
The third vertex is point with coordinates, S subscript 2 and p superscript W.
The area labeled e is a rectangle with the following vertices.
The first vertex is point with coordinates, S subscript 2 and p superscript W.
The second vertex is point with coordinates, S subscript 2 and p star.
The third vertex is point with coordinates, D subscript 2 and p star.
The fourth vertex is point with coordinates, D subscript 2 and p superscript W.
The right plane is labeled (b) World Market.
The horizontal axis is labeled as Exports, with points, X subscript 1, X subscript 3, and X subscript 2, indicated from left to right. The vertical axis is labeled as World Price, with points, p star, p star prime, p superscript W, p star prime plus one half times s, and p prime plus s, indicated from bottom to top.
A straight line sloping downward from the left upper corner to the right lower corner of the plot is drawn. It is labeled Foreign import demand, M star.
Another straight line sloping upwards from the left lower corner to the right upper corner of the plot is drawn. It is labeled Home export supply, X.
Two straight lines, parallel to the line X, sloping upwards from the left lower corner to the right upper corner of the plot is drawn. They are labeled, X minus half s, and X minus S, respectively. Line X minus half s lies above line X minus s, but below line X.
Lines, X and M star, intersect at point with coordinates, X subscript 1 and p superscript W.
Lines, X minus half s and M star, intersect at point with coordinates, X subscript 3 and p star prime.
Lines, X minus s and M star, intersect at point with coordinates, X subscript 2 and p star.
There are dotted lines drawn from points, X subscript 1, X subscript 3, and X subscript 2 on the horizontal axis, parallel to the vertical axis, as well as from points, p star, p star prime, p superscript W, p star prime plus one half times s, and p prime plus s, on the vertical axis, parallel to the horizontal axis.
The area labeled b plus d is a triangle with the following vertices.
Th first vertex is a point with coordinates, X subscript 1 and p superscript W.
The second vertex is a point with coordinates, X subscript 2 and p star plus s.
The third vertex is a point with coordinates, X subscript 2 and p superscript W.
The area labeled e prime is a rectangle with the following vertices.
The first vertex is a point with coordinates, 0 and p star.
The second vertex is a point with coordinates, 0 and p superscript W.
The third vertex is a point with coordinates, X subscript 2 and p superscript W.
The fourth vertex is a point with coordinates, X subscript 2 and p star.
The area labeled f is a triangle with the following vertices.
The first vertex is a point with coordinates, X subscript 3 and p star prime.
The second vertex is a point with coordinates, X subscript 2 and p star.
The third vertex is a point with coordinates, X subscript 2 and p superscript W.
A downward arrow labeled s is drawn on right part of the line, X minus half s.
(Speaker)
There are ambiguous gains to the large exporting country. Not only the deadweight losses decrease but terms-of-trade losses due to the subsidy are also diminished. As shown in the graph, cutting subsidies in half will shift the export supply curve up to X minus half s. The world price of agriculture increases from P star to P star prime, and domestic prices for agriculture drop from P star plus s to P star prime plus half s. So consumer surplus increases and the Home terms-of-trade improves, and deadweight losses decrease, as represented by the reduced area negative(b plus d plus e).