Chapter 11. Chapter 11

Work It Out
Chapter 11
true
true
You must read each slide, and complete any questions on the slide, in sequence.

Question 11.1

Consider the following variation of Table for the U.S. semiconductor market:

U.S. Tariff
0% 8% 16%
From Canda, before NAFTA $45 $[MATH: W](W) $52.2
From Asia, febore NAFTA $40 $[MATH: X](X) $[MATH: Y](Y)
From Canada, after NAFTA $43 $[MATH: Z](Z) $[MATH: Z](Z)
From Asia, after NAFTA $40 $[MATH: X](X) $[MATH: Y](Y)
From the united States $46 $46 $46
a. Fill in the values for [MATH: W](W) , [MATH: X](X) , [MATH: Y](Y) , and [MATH: Z](Z) .
[MATH: W](W) = $FLw+H7DP3NcxHrKwjS+3e5YpD6y6zcMEcO1G+4hX0OTcI/Uz0ujfEA==

[MATH: X](X) = $JpfgB5o0ZRmyKoDV84Fq4BMg6Xyva9ONaXEwsBFGAF0sVvsMjuV+ZQ==

[MATH: Y](Y) = $5AdP+zA7AXmdMFnMA60GrO3byjD8HCbzShR2wz0gPpe2KvsoqyyKTw==

[MATH: Z](Z) = $kjy4deUNei1unRk9Fmlh79bK/kX3LXZtlSQNhTgBRYDxKH3scPnqVF/gDWM=
Correct. [MATH: W = 48.60 ]() , [MATH: X = 43.20 ]() , [MATH: Y = 46.40 ]() , [MATH: Z = 43.00 ]()
Incorrect. [MATH: W = 48.60 ]() , [MATH: X = 43.20 ]() , [MATH: Y = 46.40 ]() , [MATH: Z = 43.00 ]()
Video transcript

Work It Out, Chapter 11, Question 1

(Transcript of audio with descriptions. Transcript includes narrator headings and description headings of the visual content)

(Speaker)
This problem will ask you to fill in the values for W, X, Y, and Z in the table for the U.S. semiconductor market.

(Description)
The following table is shown. The table consists of one individual column and one column group spanning three columns. The individual column has no label, the column group is labeled as U.S. Tariff, its columns are labeled as 0 percent, 8 percent, and 16 percent, respectively. The table has five rows. The first row, labeled From Canada, before NAFTA, has the following data: 45 dollars, W dollars, 52.20 dollars. The second row, labeled From Asia, before NAFTA, has the following data: 40 dollars, X dollars, Y dollars. The third row, labeled From Canada, after NAFTA, has the following data: 43 dollars, Z dollars, Z dollars. The fourth row, labeled From Asia, after NAFTA, has the following data: 40 dollars, X dollars, Y dollars. The fifth row, labeled From the United States, has the following data: 46 dollars in all columns.

(Speaker)
To determine the values of W, X, Y, and Z, we simply multiply the original no tariff value by the tariff and then add that value to the original value. W is therefore (45 dollars times 0.08) plus 45, which equals 3.6 plus 45 equals 48 dollars 60 cents.

(Description)
The corresponding value, W dollars, in the first row and third column changes to, 48.60 dollars. It is highlighted.

(Speaker)
X is (40 dollars times .08) plus 40, which equals 3.2 plus 40 equals 43 dollars 20 cents.

(Description)
The corresponding values, X dollars, in the second and fourth rows and third column change to 43.20 dollars. They are highlighted.

(Speaker)
Y is (40 dollars times 0.16) plus 40, which equals 6.4 plus 40 equals 46 dollars 40 cents.

(Description)
The corresponding values, Y dollars, in the second and fourth rows and fourth column change to 46.40 dollars. They are highlighted.

(Speaker)
And finally, Z is 43 dollars, since it is the value of production from Canada, after NAFTA, which means it is not subject to tariffs.

(Description)
The corresponding values, Z dollars, in the third row and third and fourth columns change to 43 dollars. They are highlighted.

Question

b. Suppose that before NAFTA, the United States had a 16% tariff on imported semiconductors. Which country supplied the U.S. market? Is it the lowest-cost producer?

g3XM3yR9xLzPN90RZ/q/Uc2XHJKgL07+dBRH7qcA26ANaroQzaWfQcp+V226uadIljW1K3UvLl9WU8d6k+IZyEgbubUpkDq4xxLHYQl0LvEVjfqLQCLfibFJt1Val2lIkmAO83CB2NYndj7pc7pdUNgRlYA5ZGC9EoEDora3jl43WXCFvw2Z1DuUExlS22vtmvgQuZsu1KRzHPlsyu25/dJEA/ttDShALRGuPstaVnAUFUmf6elJKilCRvO1EwWQapYOWg==
Correct. Assuming the 16% tariff on imported semiconductors, the least expensive option for U.S. consumers was the domestically produced semiconductor at $46, even though the lowest cost producer (net-of-tariff) was Asia at $40.
Incorrect. Assuming the 16% tariff on imported semiconductors, the least expensive option for U.S. consumers was the domestically produced semiconductor at $46, even though the lowest cost producer (net-of-tariff) was Asia at $40.
Video transcript

Work It Out, Chapter 11, Question 2

(Transcript of audio with descriptions. Transcript includes narrator headings and description headings of the visual content)

(Speaker)
This problem now will ask you to suppose that before NAFTA, the United States had a 16 percent tariff on imported semiconductors. Which country supplied the U.S. market? Is it the lowest-cost producer?

(Description)
The table from Question 1 is shown. The value, 46 dollars, in the fifth row and fourth column is highlighted.

(Speaker)
Before NAFTA, the least expensive option for U.S. consumers was the domestically produced semiconductor, even though the lowest-cost producer (net-of-tariff) was Asia.

Question

c. After NAFTA, who supplies the U.S. market? Has either trade creation or diversion occurred because of NAFTA?

5yePQJWGjBFofyKIUoXtScpKTrdemJ0tomtk/jVNJTeE+V3MoHHSUfAWBFvHI/mgHBwcadK5ZrN/Jwb+b5Uo3YkDD+mtYwrZ1jUDA79X27EmrXVQLrpV28+Yy3C4SF5jM+Pm5WTIWKtvtagFYIgobzakj9Aigd+qs7y0it+d7Rplzx6/gsOEzsbf5uH+vO4T+qKbYAc4wqhrTjPN5Au+71l3ispnGZF7MvpykxH+uZO6D1FvhYhdUdz6kCUi2QJP7K/EMg==
ewlhtNTo/uBaajF+xtwA4Kg1ePvJSIJICULqUUwBo9zSvLHtb89STSKmtBQC37sgNYHehB2FWrbzqiHOWUODPgH240jhun2AUlEIVmn7HgUAm7MLxuCKh7kg0h4sWdoev68i+5Q7nTJZQOwrNgXP3A==
Correct. After NAFTA, the least expensive option for U.S. consumers is semiconductors produced in Canada. Semiconductors from Canada now cost $4, which is less than the cost of producing domestically, $46. This is an example of trade creation because new trade between Canada and the United States has been created as a result of NAFTA.
Incorrect. After NAFTA, the least expensive option for U.S. consumers is semiconductors produced in Canada. Semiconductors from Canada now cost $4, which is less than the cost of producing domestically, $46. This is an example of trade creation because new trade between Canada and the United States has been created as a result of NAFTA.
Video transcript

Work It Out, Chapter 11, Question 3

(Transcript of audio with descriptions. Transcript includes narrator headings and description headings of the visual content)

(Speaker)
This problem now will ask you to determine which country, after NAFTA, supplies the U.S. market. Has either trade creation or diversion occurred because of NAFTA? Explain.

(Description)
The table from Question 1 is shown.

(Speaker)
After NAFTA, the least expensive option for U.S. consumers is the semiconductor produced in Canada. Semiconductors from Canada now cost dollars, which is less than the cost of producing domestically, 46 dollars. This is an example of trade creation because new trade between Canada and the United States has been created as a result of NAFTA.

Question

d. Now suppose that before NAFTA, the United States had an 8% tariff imported semiconductors. Now repeat parts (b) and (c).

oRtwTKsky4qhcayLjfiELebkLSdqR5s2X0/ro/iHh/26uvHDYX1d9GUCSb8poaST0zB4nRQgjmTSz8Q5+yuEDOt01ETI+It5vQfydUI6noGS6tYGUQB3Yd3HLJDwQXmr8bVLvb2J/yqDXUIM7UL6Yn7V8zrqMn+ZrYBjTRHjww/9FXCVWg4moKS7y3g9lSwAk/Y3QYmUTYq/99/ztrC3jy+B9/M5TRNWrAsogXFHHbWTWg0OR72iKroU2REQ1O7y+wen1Qz+GvYvmmCmKq5JGg/WT1cRB2+gB+5tPhfzBKwo2mZaT/wEmzAHvHJ6OW6I
Correct. Asia at a cost of $43.20. In this case, Asia is the lowest cost producer, so despite the tariff, the most efficient country is producing semiconductors.
Incorrect. Asia at a cost of $43.20. In this case, Asia is the lowest cost producer, so despite the tariff, the most efficient country is producing semiconductors.

Question

eBsHRlaLBAnzUBUYrx3Dr5pTC0kTcbPfJwGvJm5/kSVI0C+h8Cp3GVxc2ANbdHCQ+w4N0KZkc+EttCONpFc8vDUrKSJa3txnTXQXi7I6qghy1ry8ulOVcdIH/g4jcMqt0TcRB6Fc1MEOR0msyQmxjzvjvQCgW1rvsUaWPxpTrjIofdMIVJf/yzeN89jjP3ZB1MIVZsiCkw/ao9qY21y6juQVX+MgjlR4zSlzw/7lAXbGLyFTV2Rdp+9QwHEv+ABSHgOaLwNKAjk= TaMiOmfvaRy9UOTXTDp5UoqFa7zeRl4wYQGUd3U5wV9F8YhxXY+JcoPAq9jffzfSJ4duvVM+HBv8wDvMPrO8vlDdI43YKg8ItqroHQL6vT+M6UdRJ5aVf9H8yGUMyiv10n2La5cx5TPOK/CxF0DOTA==
Correct. After NAFTA, the cost of importing semiconductors from Canada drops from $48.60 to $43.00, which means the United States will stop importing from Asia (the lowest cost producer) and instead import from Canada. This is an example of trade diversion because trade is being diverted from Asia to Canada.
Incorrect. After NAFTA, the cost of importing semiconductors from Canada drops from $48.60 to $43.00, which means the United States will stop importing from Asia (the lowest cost producer) and instead import from Canada. This is an example of trade diversion because trade is being diverted from Asia to Canada.
Video transcript

Work It Out, Chapter 11, Question 4

(Transcript of audio with descriptions. Transcript includes narrator headings and description headings of the visual content)

(Speaker)
Now suppose that before NAFTA, the United States had an 8 percent tariff on imported semiconductors. Now repeat parts (b) and (c).

(Description)
The table from Question 1 is shown.

(Speaker)
If the United States had an 8% tariff before NAFTA, the United States would import semiconductors from Asia at a cost of $43.20

(Description)
The corresponding value, 43.20 dollars, in the second row and third column is highlighted.

(Speaker)
In this case, Asia is the lowest-cost producer, so despite the tariff, the most efficient country is producing semiconductors. However, after NAFTA, the cost of importing semiconductors from Canada drops from 48 dollars 60 cents to 43 dollars, which means the United States will stop importing from Asia (the lowest-cost producer) and instead import from Canada.

(Description)
The corresponding value, 43 dollars, in the third row and second column is highlighted.

(Speaker)
This is an example of trade diversion.

Question

e. In addition to the assumptions made in (d), consider the effect of an increase in high-technology investment in Canada due to NAFTA, allowing Canadian firms to develop better technology. As a result, three years after the initiation of NAFTA, Canadian firms can begin to sell their products to the United States for $40. What happens to the U.S. trade pattern three years after NAFTA? Has either trade creation or trade diversion occurred because of NAFTA?

The figure shows the U. S. trade pattern three years after NAFTA.
image1

The figure is a 2d plot that shows the U. S. trade pattern three years after NAFTA. The horizontal axis is labeled Import quantity. The vertical axis is labeled Price. Five lines are shown on the plot. Two parallel horizontal lines, labeled, S sub Asia plus t, and, S sub Asia, start at the price values, P sub Asia plus t, and, P sub Asia, respectively. The demand curve, labeled M sub US, crosses S sub Asia plus t curve at the point A when the import quantity is Q 1, and the curve S sub Asia at the point D. There are also three increasing supply curves. The line, called S sub Mex plus t, crosses S sub Asia plus t at the point B when the import quantity is Q 2. The line, called, S sub Mex, crosses S sub Asia plus t at the point C when the import quantity is Q 3. The line, called S prime sub Mex, crosses S sub Asia at the point D. The area between S sub Asia plus t and S sub Asia lines, limited from 0 to Q 3, is a plus b plus c. The area between S sub Asia plus t and S sub Asia lines, limited from Q 3 to Q 1, is d. The area of the triangle with vertices at the points A, D and the point with coordinates Q 1 and P sub Asia is e.


d. K+kQpS7Gyn7DKTfjpEtrD8UCXzbHGg/Pt/DJKn3T4ZZXoeEKWXOfK7piVcNAoiR9vcYSjKRFHaGamZSBcJYnZ4mQnRghPAhTpRFfA9X/R/7OTahNKqvmA75vFKXgoYxH1pFX5i8ThrOgkUIWZtKj+1veLIYq4hsMYl/MN4GF09ccz/KztdmAsGqA6SxzA9zHie2A/A71cG9ayyJVNBkW9pGDDzB8U5r26dhX4fTUjlXl2OWn1p5mxqzoRb0ZEeEhx4vPl3TMqXj/OkP4GLzliUGt2SdnKLgjNVBI1i/4TMu2W+cCHdV+5E8xyjQ=
tuesmWthZi5Px7A6IhF9VQt0/3kahk2wEiJ9GtCtI3lRqBUTg8UdTHm7UeaElvkE8puySPprfKW8i38+Tps2qthuxrH0qE7uyVldzeKY1EGf06/fYbJ7DfqVmU3jtsvxcc3YE3Zb/Zj2SIr3FWm+TQ==
Correct. Three years after NAFTA, with better technology, the marginal cost of production is significantly reduced for Canada so that its supply curve shifts out. Now Canada will fully replace Asia as the supplier of semiconductors to the United States. This is an example of both trade diversion and trade creation. The United States will lose its tariff revenue from Asia, but it experiences a net gain in consumer surplus, because the area of the tariff revenue, area [MATH: a+b+c ]() in Figure 11-3, becomes consumer surplus, and area [MATH: d+e ]() is the net gain in U.S. consumer surplus. Canadian producer surplus rises because it is exporting more. This case combines elements of trade diversion (Canada replaces Asia) and trade creation (Canada is exporting more to the United States) and the extent of trade creation for Canada exceeds the amount of trade diversion.
Incorrect. Three years after NAFTA, with better technology, the marginal cost of production is significantly reduced for Canada so that its supply curve shifts out. Now Canada will fully replace Asia as the supplier of semiconductors to the United States. This is an example of both trade diversion and trade creation. The United States will lose its tariff revenue from Asia, but it experiences a net gain in consumer surplus, because the area of the tariff revenue, area [MATH: a+b+c ]() in Figure 11-3, becomes consumer surplus, and area [MATH: d+e ]() is the net gain in U.S. consumer surplus. Canadian producer surplus rises because it is exporting more. This case combines elements of trade diversion (Canada replaces Asia) and trade creation (Canada is exporting more to the United States) and the extent of trade creation for Canada exceeds the amount of trade diversion.
Video transcript

Work It Out, Chapter 11, Question 5

(Transcript of audio with descriptions. Transcript includes narrator headings and description headings of the visual content)

(Speaker)
Now, in addition to the assumptions made in (d), consider the effect of an increase in high-technology investment in Canada due to NAFTA, allowing Canadian firms to develop better technology. As a result, three years after the initiation of NAFTA, Canadian firms can begin to sell their products to the United States for 40 dollars. What happens to the U.S. trade pattern three years after NAFTA? Has either trade creation or trade diversion occurred because of NAFTA? Explain.

(Description)
The table from the Question 1 is shown. The only difference is that a row labeled, From Canada 3 yrs after NAFTA, is put between the third and the fourth rows of the table. It has the following data: 40 dollars, 40.00 dollars, 40.00 dollars.

(Speaker)
With better technology, marginal cost of production significantly reduces for Canada so that its supply curve shifts out. Now Canada will fully replace Asia as the supplier of semiconductors to the United States. The United States will lose its tariff revenue from Asia, but it experiences a net gain in consumer surplus. Canadian producer surplus rises because it is exporting more. This case combines elements of trade diversion (Canada replaces Asia) and trade creation (Canada is exporting more to the United States), and the extent of trade creation for Canada exceeds the amount of trade diversion.

(Description)
Two coordinate planes with the horizontal x-axis and the vertical y-axis are drawn. 
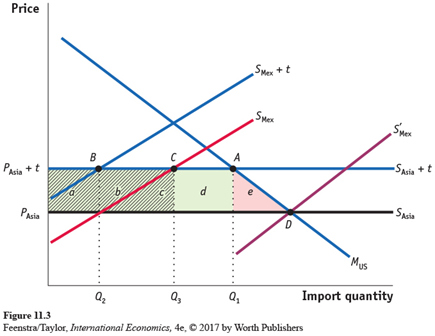
The horizontal axis is labeled as Import quantity, with points, Q subscript 2, Q subscript 3, and Q subscript 1, indicated from left to right. The vertical axis is labeled as Price, with points, P subscript Asia, and P subscript Asia plus t, indicated from bottom to top. Two straight lines parallel to the horizontal axis extend from points, P subscript Asia, and P subscript Asia plus t, on the vertical axis. They are labeled S subscript Asia, and S subscript Asia plus t, respectively. A straight line sloping downward from the left upper corner to the right lower corner of the plot is drawn. It is labeled M subscript US. Two straight lines sloping upwards from the left lower corner to the right upper corner of the plot are drawn. They are labeled S subscript Mex, and S subscript Mex plus t. They have the same slope, but line, S subscript Mex is below line, S subscript Mex plus t. Another straight line sloping upwards from the lower area to the right upper corner of the plot is drawn. It is labeled S prime subscript Mex. Point, A, is the intersection between lines, S subscript Asia plus T, and M subscript US. Its coordinates are, Q subscript 1 and P subscript Asia plus t. Point, B, is the intersection between lines, S subscript Asia plus T, and S subscript Mex plus t. Its coordinates are, Q subscript 2 and P subscript Asia plus t. Point, C, is the intersection between lines, P subscript Asia plus T, and S subscript Mex. Its coordinates are, Q subscript 3 and P subscript Asia plus t. Point, D, is the intersection between lines, M subscript US, and S prime subscript Mex. The area labeled a is represented by a rectangle with the following vertices. The first vertex is a point with coordinates, 0 and P subscript Asia. The second vertex is a point with coordinates, 0 and P subscript Asia plus t. The third vertex is point B. The fourth vertex is a point with coordinates, Q subscript 2 and P subscript Asia. The area labeled b is represented by a triangle with the following vertices. The first vertex is point B. The second vertex is point C. The third vertex is a point with coordinates, Q subscript 2 and P subscript Asia. The area labeled с is represented by a triangle with the following vertices. The first vertex is a point with coordinates, Q subscript 2 and P subscript Asia. The second vertex is point C. The third vertex is a point with coordinates, Q subscript 3 and P subscript Asia. The area labeled d is represented by a rectangle with the following vertices. The first vertex is point C. The second vertex is point A. The third vertex is a point with coordinates, Q subscript 1 and P subscript Asia. The fourth vertex is a point with coordinates, Q subscript 3 and P subscript Asia. The area labeled e is represented by a triangle with the following vertices. The first vertex is point A. the second vertex is point D. The third vertex is a point with coordinates, Q subscript 1 and P subscript Asia. The area consisting of areas, a, b, and c, is hashed. The area, e, is dashed.

(Speaker)
Figure 11-3 illustrates the net benefit for the United States. The area of tariff revenue a plus b plus c is lost to the government but becomes consumer surplus. Area d plus e represents the net gain in consumer surplus for the United States from the trade diversion.