3 International Agreements on the Environment
WTO trade policies affect the environment, but the WTO does not directly address environmental issues. There are many other multilateral agreements on the environment.
1. Environmental Issues in the GATT and WTO
WTO explicitly gives countries the right to apply their own environmental regulations. Why are critics concerned about how WTO affects the environment? Some cases (see Table 11-3 for details):
a. Tuna–Dolphin Case
b. Shrimp–Turtle Case
c. Gasoline from Venezuela and Brazil
d. Biotech Food in Europe
e. Summary of GATT/WTO Cases
Environmentalists have lost cases at the WTO, but in each case their lobbying resulted in policy changes that helped the environment.
2. Does Trade Help or Harm the Environment?
a. Externalities
Review externalities and market failure. Use R&D and pollution as examples of positive and negative externalities.
b. Externalities and Trade
Does trade ameliorate, or exacerbate, environmental externalities?
c. Negative Production Externalities
Social MC > Private MC if there is pollution. Then trade reduces the social cost of pollution because it decreases domestic production. But production increases abroad, so is there really a social gain? And what if the externality is positive?
d. Negative Consumption Externalities
Now Social MB Private MB. Then trade raises the social cost of pollution because it raises quantity demanded.
3. Examples of the Environmental Impact of Trade
a. U.S. Trade Restrictions in Sugar and Ethanol
U.S. quota on sugar induces ethanol producers to use corn rather than sugar, even though it is much less energy-efficient—an example of a negative production externality. Another import tariff on ethanol itself made the externality even worse because it increased domestic production.
b. U.S. Automobile VER
Japanese VERs on autos caused the size and weight of imported cars to increase, reducing mileage and increasing carbon emissions—an example of a negative consumption externality.
4. The Tragedy of the Commons
Explain the tragedy of the commons and the dangers of overharvesting of a resource. Trade may make this worse because it increases demand for the resources of specific countries.
a. Trade in Fish
Many species of fish are close to extinction because of overfishing. This is happening because fish are regarded as common property; trade makes this worse. It could be alleviated by international agreements to assign property rights and limited harvests.
b. Trade in Buffalo
Decimation of the Buffalo in the U.S. was caused by the invention in London of a device that could tan buffalo hides for industrial use.
c. Trade in Solar Panels
Solar panels confer a positive externality by reducing the use of fossil fuels. Trade should increase these social gains. Chinese subsidies should make the gain even larger, but the U.S. and EU object to them. Why? It is a global external benefit, so no one country wants to endanger its own import-competing firms.
d. Trade in Rare Earth Minerals
Processing of rare earths creates low-grade radioactive waste, a negative externality. It is not possible to constrain demand for rare earths, so the only solution is to regulate disposal of the waste.
5. International Agreements on Pollution
Global pollution as a tragedy of the commons problem.
a. Global Pollutants
The prisoner’s dilemma again
b. Payoff Matrix
A prisoner’s dilemma game with two players, Home and Foreign, and two strategies, regulate and don’t regulate.
c. Nash Equilibrium
Neither country regulates, and both are worse off.
d. Multilateral Agreements
Agreements commit both players to regulating, so that both are better off. Example of a successful agreement: Montreal Protocol on ozone emissions. A more problematic example: global warming.
Many of the protesters at the 1999 Seattle meeting of the World Trade Organization (WTO), shown in the photo at the start of this chapter, were concerned about how WTO rulings affect the environment. The WTO does not directly address environmental issues; other international agreements, called multilateral environmental agreements, deal specifically with the environment. There are some 200 multilateral environmental agreements, including the Convention on International Trade in Endangered Species (CITES) and the Montreal Protocol on Substances that Deplete the Ozone Layer (which has eliminated the use of chlorofluorocarbons which deplete the ozone layer). But the WTO still indirectly affects the environment as the protesters in Seattle were well aware. We begin by clarifying the role of the GATT and WTO in environmental issues.
Environmental Issues in the GATT and WTO
In an earlier chapter (see Side Bar: Key Provisions of the GATT in Chapter 8), we summarized some of the founding articles of the General Agreement on Tariffs and Trade (GATT). Not mentioned there was Article XX, known as the “green provision.” Article XX allows countries to adopt their own laws in relation to environmental issues, provided that these laws are applied uniformly to domestic and foreign producers so that the laws do not discriminate against imports.
Note that GATT has a "green provision," that recognizes the right of countries to implement their own environmental policies, provided they aren't disguised protectionist policies. But ask, what does that mean in practice?
In its full text, Article XX of the GATT states that “subject to the requirement that such measures are not applied in a manner which would constitute a…disguised restriction on international trade, nothing in this Agreement shall be construed to prevent the adoption or enforcement by any contracting party of measures: …(b) necessary to protect human, animal or plant life or health; …(g) relating to the conservation of exhaustible natural resources if such measures are made effective in conjunction with restrictions on domestic production or consumption.”
If the provisions of the GATT and WTO permit countries to apply their own environmental regulations, why were people dressed as turtles and dolphins protesting WTO rulings at the 1999 Seattle meetings? To understand the concerns of these protesters, we need to dig into the details of some specific GATT/WTO cases, summarized in Table 11-3.15
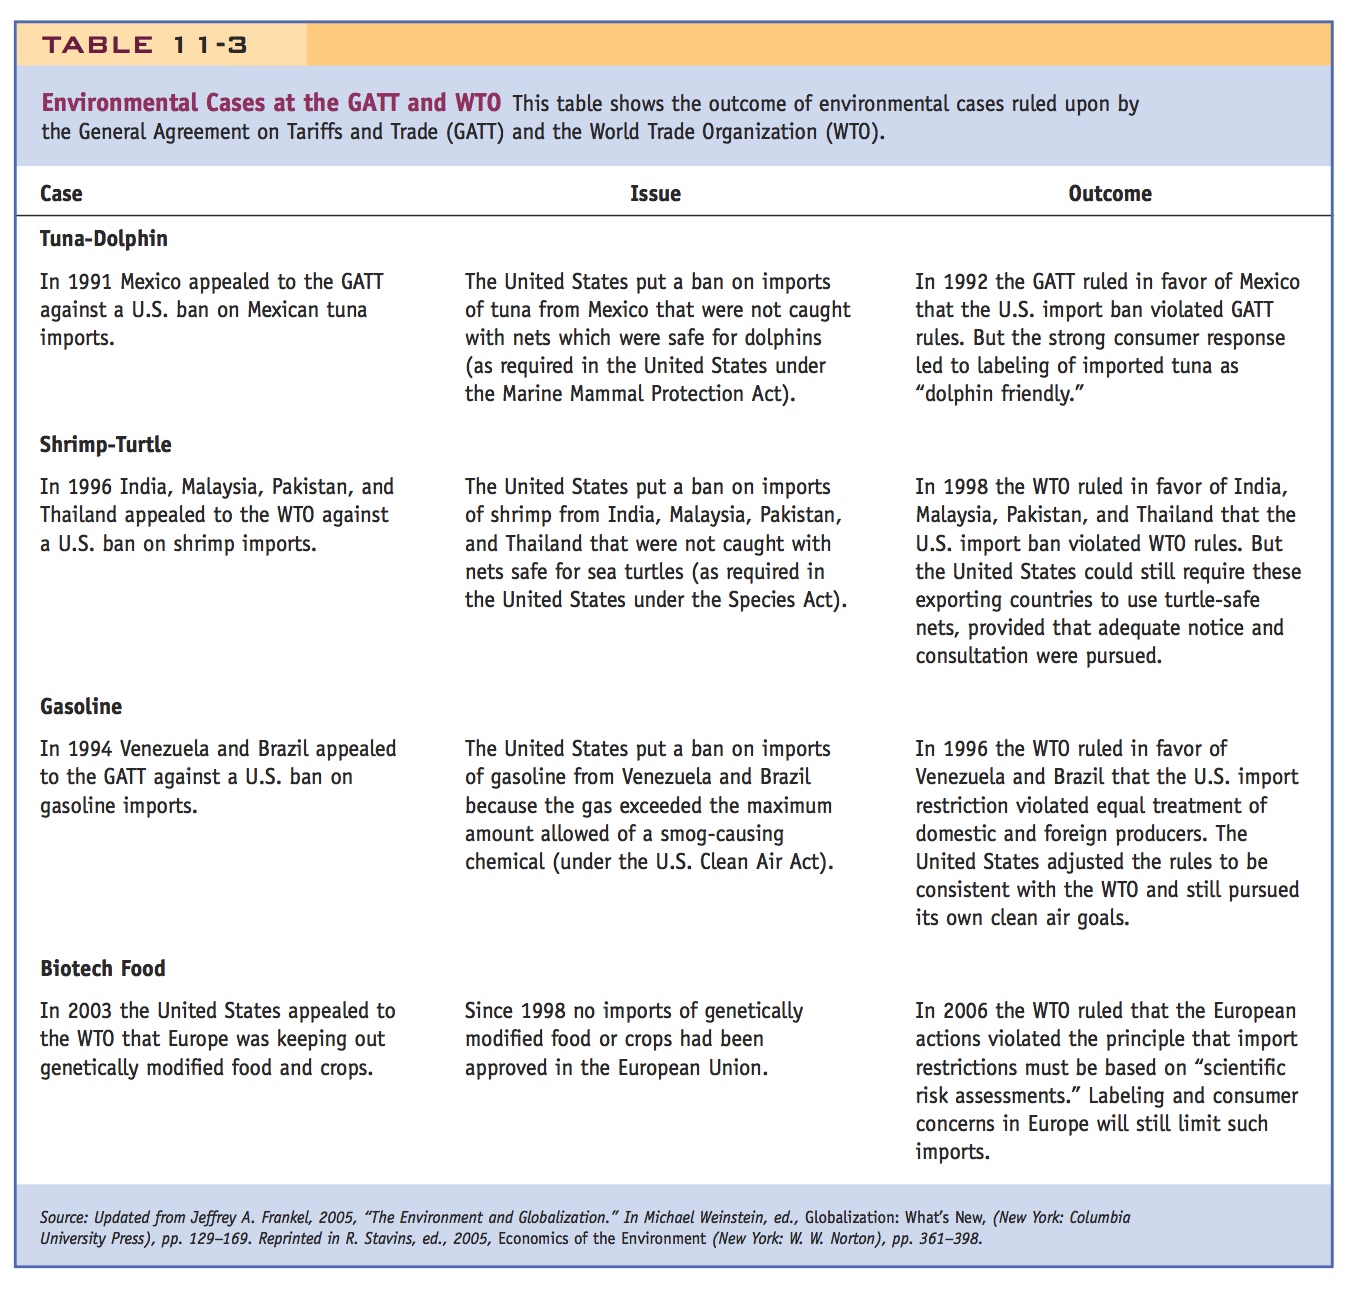
Tuna–Dolphin Case In 1991, before the WTO was formed, Mexico brought a GATT case against the United States. The reason for the case was that the United States had banned imports of tuna from Mexico because Mexican fishermen did not catch tuna using nets that safeguarded against the accidental capture of dolphins. The U.S. Marine Mammal Protection Act requires that U.S. tuna fishermen use nets that are safe for dolphins, and by Article XX(g) of the GATT, the United States reasoned that the same requirement could be extended to Mexican fishermen. But the U.S. ban on imports of tuna from Mexico ran afoul of the GATT.
GATT concluded that the United States could not ban the import of tuna because the United States applied the import restriction to the production process method and not the product itself. The idea that the production process could not be a basis for a trade restriction was a principle of GATT that was upheld in this case. In addition, the GATT panel ruled that “GATT rules did not allow one country to take trade action for the purpose of attempting to enforce its own domestic laws in another country—even to protect animal health or exhaustible natural resources.” Both of these conclusions were a blow to environmentalists interested in protecting the dolphins, and this is the reason that some of the Seattle protesters were dressed as dolphins.
389
Even though the GATT panel ruled in favor of Mexico and against the United States in this case, the strong consumer response led to the dolphins being protected. Interested parties in the United States and Mexico worked out a system of labeling that now appears on cans of tuna in the United States, declaring the product to be “dolphin-safe.” Since 1990 the major companies have sold only this “dolphin friendly” product from Mexico, and the labeling procedure was found to be consistent with GATT. So despite the initial ruling against the United States, the outcome of this case has had the desired effect of protecting dolphins in Mexican waters (in addition to the protection they already received in U.S. waters).
390
Shrimp–Turtle Case In 1996, just after the WTO was formed, a second closely related case arose involving shrimp and sea turtles. In this case, India, Malaysia, Pakistan, and Thailand appealed to the WTO against a U.S. ban on shrimp imports. The United States had banned imports of shrimp from these countries because they were not caught with nets that were safe for sea turtles, as required in the United States under the Endangered Species Act of 1987. Again, by Article XX(g) of the GATT, the United States reasoned that the same requirement could be extended against fishermen from these Asian countries.
Although this case has a number of similarities to the earlier tuna–dolphin case, the outcome at the WTO was different. The WTO still ruled against the United States, but in this case it did not rule against the principle that one country could restrict imports based on the production process method used in another country. On the contrary, the WTO ruled that the United States was consistently applying its laws to American and Asian producers in requiring that turtle-safe nets be used. The problem with the U.S. import ban was that it was applied without due notice and consultation with the exporting countries involved, which did not allow the countries sufficient time to employ turtle-safe devices. In other words, the WTO ruling against the United States was on narrow, technical grounds and not on the principle of protecting endangered species in foreign waters.
In many ways, this WTO ruling was more favorable to environmentalists than the earlier tuna–dolphin ruling at the GATT. The WTO panel explicitly recognized that “the conservation of exhaustible natural resources” referred to in Article XX(g) applies to living resources, especially if they are threatened with extinction. After the United States allowed more flexibility in its regulations and made good-faith efforts to develop an agreement with the Asian producers, the laws requiring the use of turtle-safe nets for exporters were found to be consistent with the WTO in a 2001 ruling.
Gasoline from Venezuela and Brazil A third GATT/WTO case that involves environmental issues was brought against the United States by Venezuela and Brazil in 1994. The United States had restricted imports of gasoline from these countries because the gas did not meet the requirements of the U.S. Clean Air Act (which mandates a maximum amount of certain smog-causing chemicals). In this case, the WTO ruled in 1996 that the United States violated the principle that national and foreign producers should be treated equally. The issue was that refineries in the United States were given a three-year grace period to meet the Clean Air Act goals, whereas that grace period was not extended to refineries abroad. So the U.S. import restriction discriminated against the refineries in Venezuela and Brazil.
This gasoline case is often seen as a loss for environmentalists, but economists would argue that U.S. regulations were in fact acting like “disguised protection” against the import of Venezuelan gasoline. From the perspective of promoting free trade and treating foreign producers fairly, the WTO was correct in ruling against the United States. The United States was not blocked by the WTO in pursuing clean air goals, but it had to modify its requirements so that they were applied equally to U.S. and foreign producers.
391
Biotech Food in Europe A final case concerns whether food that has been genetically modified can be imported into Europe. In 2003 the United States (joined by Argentina and Canada) appealed to the WTO that the European Union (EU) was keeping out genetically modified food and crops. Since 1998 no such imports had been approved in the EU, though it denied that there was any “moratorium” on these imports. Rather, Europe claimed that it needed more time to study the health effects of genetically modified organisms and was not approving such imports for precautionary reasons.
The WTO ruled in 2006 that the European actions violated the principle that import restrictions must be based on “scientific risk assessments.” That is, countries cannot keep out imports based on precautionary reasons but must have some scientific evidence to back up the import restriction. Despite this ruling, the EU can use consumer labeling to allow the buyers to decide whether to purchase foods that have been genetically modified. As in our earlier discussion of the labeling of U.S. tuna imports from Mexico, it is expected that the labeling of genetically modified organisms in Europe will allow consumers to exert their power in limiting purchases of these foods if they so choose. Since 2006, Europe has approved the import of about 50 genetically modified food products, most for animal feed imports.
The bottom line: In practice, WTO has ruled fairly consistently against trade restrictions justified by environmental considerations. However, the public furor over these cases induced changes that reduced the adverse environmental impacts.
Summary of GATT/WTO Cases The cases in Table 11-3 show that WTO rulings have not adversely affected the environment: in the tuna–dolphin case, the reaction of consumers in the United States was enough to ensure that dolphin-safe nets were used in Mexico; in the shrimp–turtle case, the WTO did not object to the principle of requiring foreign countries to use the same turtle-friendly nets as do the U.S. companies; in the gasoline case, the imports from Venezuela and Brazil had to meet the requirements of the Clean Air Act, after the same grace period given to U.S. firms; and in the case of biotech foods, labeling in Europe is expected to limit such imports if consumers so choose.
These outcomes have led some observers to conclude that even though environmentalists have lost some specific cases at the WTO, they have gained the upper hand in ensuring that environmental concerns are respected: environmentalists may have lost some battles, but they have won the war! This conclusion does not mean that environmental concerns can now be dropped. On the contrary, the lobbying activity of environmental groups, including the costumed protesters at the Seattle meetings, has been important in shifting public opinion and WTO rulings in directions that support the environment and such lobbying activities should continue to be pursued.
Does Trade Help or Harm the Environment?
Having clarified the role of the WTO in resolving specific cases brought between particular countries, let us turn to the more general question of whether trade helps or harms the environment. Many of the protesters at the 1999 WTO meetings in Seattle believed that trade is bad for the environment and that is why they demonstrated. The cases we reviewed above show that these protests can lead to increased regard for environmental protection in WTO decisions. But these cases do not answer the question of whether free trade is good or bad for the environment. To address that question, we need to introduce the idea of externalities.
392
A quick review will suffice. Give examples of positive and negative externalities and make sure the students understand why they generate market failures.
Externalities An externality occurs when one person’s production or consumption of a good affects another person. Externalities can be positive, such as when one firm’s discoveries from research and development (R&D) are used by other firms, or negative, such as when the production of a good leads to pollution. Closely related to the concept of externalities is the idea of market failure, which means that the positive or negative effects of the externality on other people are not paid for. For example, when the discovery of one firm is freely copied by another firm, there is a failure of the second firm to pay for the knowledge; and when a firm freely pollutes, there is a failure of that firm to pay penalties for the adverse effects of the pollution or to clean up that pollution.
In your intermediate microeconomics course, you learned that externalities can lead to outcomes that are not desirable from a social point of view. For example, if discoveries are freely copied, then a firm will invest too little in its R&D; and if pollution is not penalized, then a firm will pollute too much. The solution in both cases is to add some government regulations that essentially “create a market” for the cost or benefit of the externality. To encourage firms to undertake R&D, for example, nearly all governments support a patent system that allows the inventor of a new product to earn profits from its sales without fear of being copied, at least for some period. The ability of firms to patent their discoveries encourages more R&D, which is socially beneficial. To combat pollution, many countries regulate the emissions of their industries, and assess fines when these regulations are disregarded. These regulations lead to less pollution, which is again socially beneficial. These examples show how government action can improve the outcomes in the presence of externalities.
Rather than working through these various cases in your lecture, consider breaking the class into teams. Each team could argue one case to the class.
Externalities and Trade When we introduce international trade, we focus on understanding how trade interacts with externality: does trade lead to more of a negative externality, making the outcome worse, or offset it, making the outcome better? If it is too difficult to directly control the externality, perhaps because it requires coordinated action on the part of many governments, then there might be an argument to take action by controlling the amount of trade instead. As we will now show, there are some cases in which having more trade reduces the externality and raises welfare, but other cases in which having less trade is needed to achieve that outcome. The answer to the question “does free trade help or harm the environment?” is that it all depends, and either case is possible.
To show that either case is possible, we use Figure 11-4. In panels (a) and (b) we show the Home demand curve D and supply curve S for an industry. (You can ignore the curves SMC and SMB for now.) In the absence of international trade, the autarky (no-trade) price is at PA, and the quantities demanded and supplied are equal at Q0. With international trade, we assume that the world price is fixed at the level PW, less than the autarky price. The quantity demanded rises to D1 and the quantity supplied falls to S1, and the difference between them equals imports of M1 = D1 − S1.
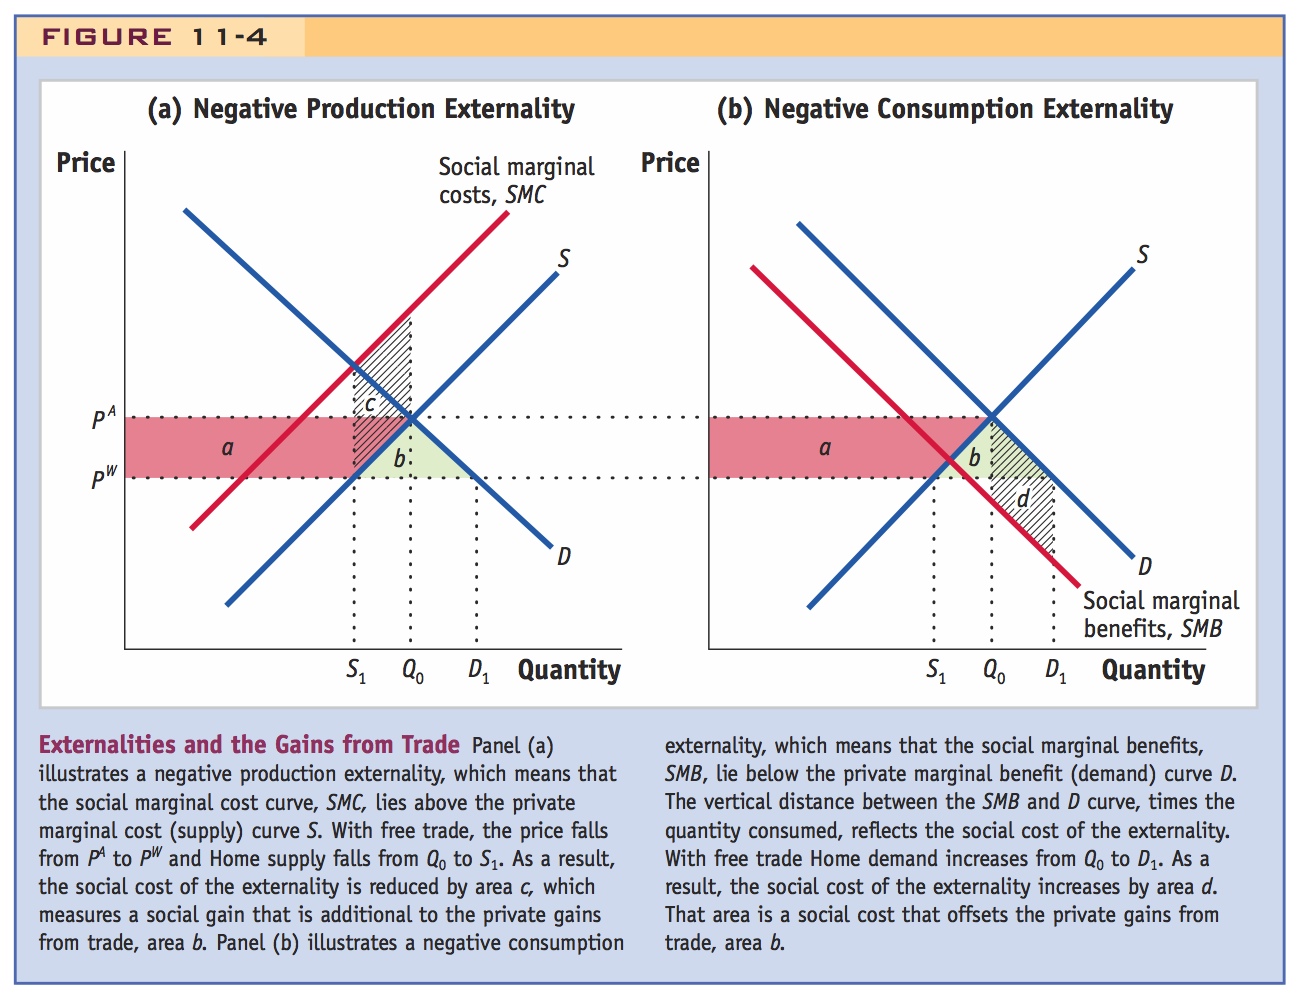
It is easy to determine the gains to this country from opening trade. With the fall in price from PA to PW, consumer surplus rises by the area a (in red) + b (in blue) and producer surplus falls by the area a. The combined effect on consumers and producers (what we call the private gains from trade) is area b. That outcome is the same as the outcome we saw in Figure 8-2. When we introduce externalities into the picture, however, this conclusion will change.
393
Negative Production Externalities The supply curve S shown in both panels of Figure 11-4 represents the marginal costs of production for firms, or what we call “private” marginal costs. When there is an externality then the true marginal costs for society, the “social” marginal costs, differ from the private marginal costs. When there is a negative production externality such as pollution, then the social marginal costs are higher than the private marginal costs, because the pollution is imposing an extra cost on society. This extra cost of pollution for each unit of quantity produced is measured by the vertical distance between the social marginal cost curve, labeled by SMC in panel (a), and the private marginal cost curve, S.
When trade is opened, we have already argued that the quantity supplied by the Home industry falls from Q0 to S1. This fall in production reduces the social cost of pollution. We can measure the reduction in the social cost by the fall in production times the distance between the SMC and S curves. In other words, the shaded area c in panel (a) is the reduction in the social cost of pollution. This reduced social cost should be counted as a gain. This social cost gain is added to the private gains from trade (area b), so the total gains from trade in this case is the amount (b + c). When there is a negative production externality at Home, then, free trade reduces the externality as compared with autarky and leads to additional social gains.
If we change our assumptions, however, the opening of trade will not necessarily lead to an additional gain. There are a number of cases in which the external cost increases instead of falling, a change that leads to social losses. For example, suppose production externality is positive instead of negative, as would be the case if the industry is engaged in R&D that has spillover benefits for another industry. If the industry doing research has reduced its output because of import competition, then the spillover benefits to the other industry will fall and there will be a social loss rather than a social gain. We studied such a case in Chapter 9, where we said that such a loss might justify an “infant industry” tariff to offset it.
394
Even when the production externality is negative, as shown in panel (a), we might not end up with world gains from trade when we take into account the Foreign country, too. The reduction in supply at Home and the accompanying reduction in the external cost might be offset by an increase in supply in Foreign and an increase in social external cost there. With pollution, for example, we need to consider whether the reduction in pollution at Home due to lower local supply is really a social gain if the Foreign country experiences an increase in pollution due to its additional exports. We discuss this possibility further in real-world cases in later sections.
Emphasize that since pollution does not respect boundaries it is important to remember these cross-country interactions.
Negative Consumption Externalities In addition to the externality that can arise from production, it is possible that the consumption of a good leads to an externality. An example is the consumption of automobiles that use gasoline, and therefore create carbon monoxide, which contributes to smog and carbon dioxide, which then contribute to global climate change. Negative consumption externalities like these mean that the true, social benefit of consuming the good, measured by curve SMB, is less than the private benefit from consumption as measured curve D, which shows the price that consumers are willing to pay. For example, in panel (b) of Figure 11-4 consumers are willing to pay the price PW to consume the amount D1. That the SMB curve lies below the demand curve D indicates that the social value of consuming D1 is less than PW. The vertical distance between the SMB and D curve, times the quantity consumed, reflects the social cost of the externality.
With free trade, the quantity demanded rises from Q0 to D1. This rise in consumption increases the social cost of pollution. We can measure the increase in the social cost by the rise in the quantity consumed times the distance between the SMB and demand curves. So the shaded area d in panel (b) is the increase in the social cost of pollution. This increase in the social cost is a loss for the country, which should be counted against the private gains from trade, area b. If b > d then the country still gains from trade, but if b < d then the country loses from trade overall, because the increase in the social cost of the externality overwhelms the private gains.
Similarly, let teams take turns explaining each of these cases.
In the next sections, we look at a series of examples that illustrate both production and consumption externalities, and the idea that free trade can either help or harm the environment.
Examples of the Environmental Impact of Trade
U.S. Trade Restrictions in Sugar and Ethanol The United States maintains an import quota on sugar. The import quota leads to higher prices for American buyers, both consumers and firms, who pay domestic prices that can be as high as twice the world price. One source of demand for imported sugarcane comes from firms that are producing ethanol, an alternative (or additive) to gasoline that can be produced from sugar or corn. Because of the high import price for sugarcane, however, these firms instead purchase corn from American farmers, who are themselves subsidized by the U.S. government. As a result of the quota for sugar imports and the subsidies for corn production, much more corn than sugar is used to produce ethanol.
395
The problem with this arrangement is that producing ethanol from corn is much less energy-efficient than producing it from sugarcane. Corn depletes the soil and needs fertilizers in order to grow, which themselves use energy in their production. Because the net energy savings by making ethanol from corn and using it as a gasoline substitute are poor, it would be better to use sugarcane to produce ethanol, if it could be purchased at world prices. Alternatively, the United States would benefit from importing ethanol directly from Brazil, where it is manufactured from abundant sugarcane. But up until 2012, the United States had a tariff of 54 cents per gallon on imported ethanol, limiting what U.S. gasoline producers could purchase from abroad.
Applying this example to Figure 11-4, in panel (a) we can think of the supply curve S as representing the U.S. ethanol industry. There is a negative production externality because the U.S. ethanol industry makes ethanol from corn rather than sugar (thereby using more energy). The tariff on ethanol made that externality worse because it limited imports and led to more U.S. production. So free trade in ethanol would be a better policy: it would lead to the usual gains from trade (area b) plus a reduced social cost of the externality (area c).
In fact, the United States followed that policy by eliminating the import tariff on ethanol on January 1, 2012. As a result, imports from Brazil rose dramatically, and in 2012 the United States imported 9.6 million barrels of ethanol from Brazil. At the same time, U.S. production of ethanol from corn slowed, leading to reduced environmental costs. These facts line up well with predictions from Figure 11-4, and show that allowing free trade in ethanol has reduced the externality and brought a social gain.
Still, ethanol trade between the United States and Brazil is far from perfect. As pointed out by The Financial Times, while the United States imported 9.6 million barrels of ethanol from Brazil, it also exported two million barrels to Brazil in 2012.16 Aside from being processed from different raw materials (corn versus sugar), these barrels of ethanol are identical to the users, so there is a waste of energy in shipping the ethanol in both directions. The reason for this “two-way” trade in ethanol is that fuel companies in the United States are required by government regulation to use both ethanol made from corn and ethanol made from other sources, which in practice is made up by imports from Brazil. Those regulations led to an excess of the U.S.-produced corn ethanol, which was then sold at a discounted price back to Brazil. This “two-way” trade is a clear indication of a social waste, which can be eliminated by improved regulations in the United States.
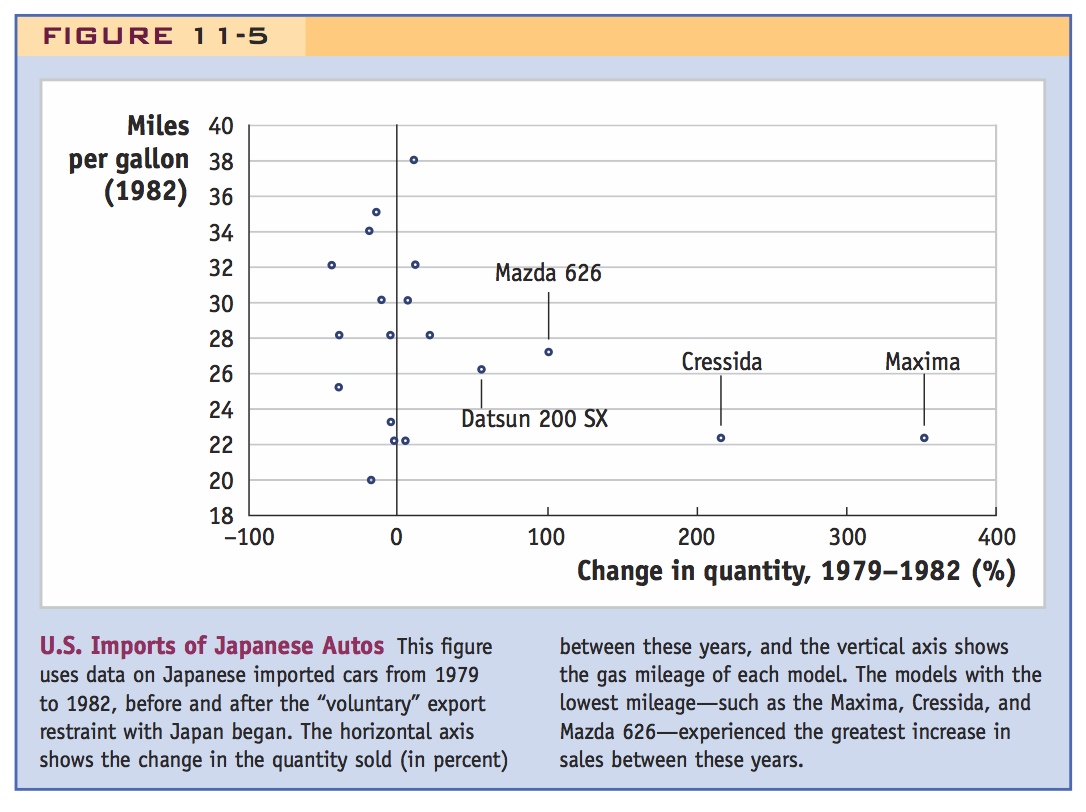
U.S. Automobile VER The tariff on ethanol is not the only case in which a U.S. trade restriction has worked to harm the environment. In an earlier chapter, we discussed the “voluntary” export restraint (VER) on exports of Japanese cars to the United States, which began in 1981. The VER limited the number of cars that Japanese firms could export each year, but not their value, so there was an incentive for the Japanese firms to export larger and/or more luxurious models. As the quality of the Japanese cars rose, so did the engine size and weight of the vehicles; as a result, the average gas mileage of the imported cars fell.
396
The impact of the VER on gas mileage is shown in Figure 11-5 which shows data on Japanese imported cars from 1979 to 1982, before and after the VER began. The horizontal axis shows the change in the quantity sold (in percent) between these years, and the vertical axis shows the gas mileage of each model. The data show that the luxury models with the lowest gas mileage—such as the Maxima, Cressida, and Mazda 626—experienced the greatest increase in sales between these years. Sales went up despite the limit on total imports because the prices of these more luxurious models did not rise as much as the prices of the economy models. U.S. consumers shifted their purchases toward the luxury models, and because those models had worse gas mileage, the VER increased the use of energy and led to greater carbon emissions from the vehicles, therefore harming the environment.
Applying this example to Figure 11-4 panel (b) we can think of the demand curve D as coming from U.S. consumers. The use of automobiles has a negative consumption externality because the carbon emissions contribute to smog and global climate change. But that externality was smaller for imported Japanese cars in the early 1980s (think of this as a positive externality for imported cars compared with domestically produced cars). So free trade would have reduced the external cost of pollution, leading to an additional source of social gain. In contrast, the VER made the externality worse by leading to an increase in imported cars with worse gas mileage.
The Tragedy of the Commons
The two previous examples, dealing with trade in ethanol and automobiles, illustrate how free trade can be good for the environment. We now turn to two other cases in which free trade has harmed the environment by leading to overharvesting of a resource. Economists believe that this outcome can occur whenever people are competing for the same resource stock (fish, for example) and refer to this phenomenon as the tragedy of the commons. When a resource is treated as common property that anyone can harvest, it will be subject to overuse and its stocks will diminish rapidly over time as each producer seeks to use as much of the resource as it can. International trade can make the tragedy of the commons worse by directing global demand toward the resources of a particular country or region so that there is even more overuse of the resource under free trade.
397
This is important enough to warrant deeper discussion. Talk about potential solutions. e.g. permits, auctions, collective action, allocation of property rights.
In terms of Figure 11-4, the tragedy of the commons illustrates a negative consumption externality that arises because of a resource is limited. International trade increases the demand for the limited good and therefore worsens the consumption externality, as shown in panel (b). When it is not possible to control the externality directly by limiting the amount of the resource being consumed, then nations should act to restrict the amount of trade.
Trade in Fish Because of overharvesting, many species of fish are no longer commercially viable and, in some extreme cases, are close to extinction. Examples include the Atlantic cod, tuna in the Mediterranean, and sturgeon in European and Asian waters. According to one scientific study, 29% of fish and seafood species have collapsed; that is, their catch declined by 90% or more between 1950 and 2003. The same authors writing in 2009 found that the “exploitation rates” of some species had fallen, but that “63% of assessed fish stocks worldwide still require rebuilding, and even lower exploitation rates are needed to reverse the collapse of vulnerable species.”17
The fundamental cause of the overharvesting of fish is not that the resource is traded internationally but that it is treated as common property by the people who are harvesting it. If instead there was a system of international rules that assigned property rights to the fish and limited the harvest of each nation, then the overharvesting could be avoided. One country acting on its own does not have enough incentive to control its fish harvest if other countries do not also enact controls. In the absence of international controls, international trade will make the tragedy of the commons in the global fishing industry worse.
International agreements for fish and other endangered species are arranged through the Convention on International Trade in Endangered Species (CITES). According to information at www.cites.org, CITES has protected 5,000 species of animals and 29,000 species of plants against overexploitation through international trade. In 2013, for example, five types of sharks were added to the CITES list of protected species.
What a great example to use in class! Don't give it to a team, keep it for yourself.
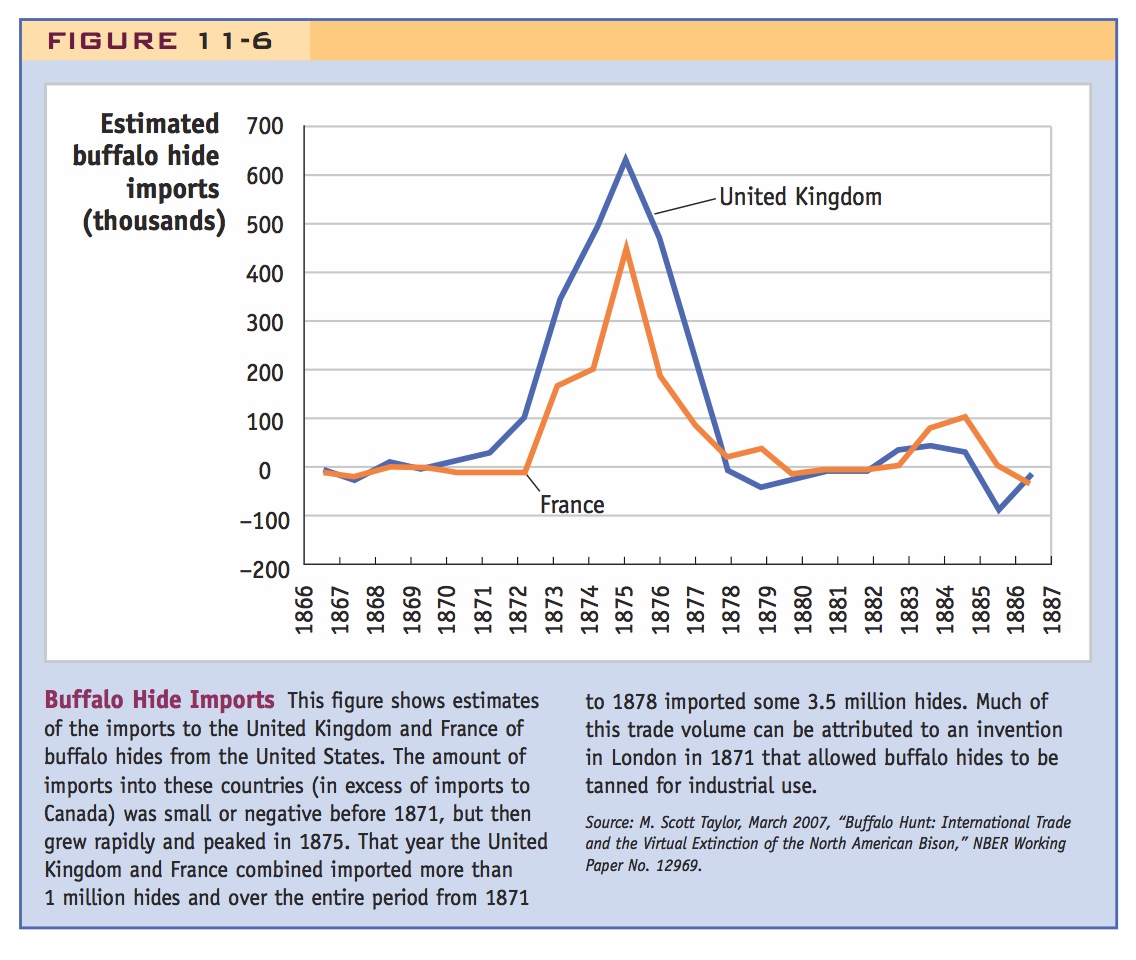
Trade in Buffalo The fish trade is not the only case in which international trade has interacted with the tragedy of the commons to result in the near extinction of a species. An historical case from America occurred with the slaughter of the Great Plains buffalo in a 10-year period from 1870 to 1880. Various reasons are often given for the slaughter: the railroad allowed hunters to reach the Great Plains easier; the buffalo were killed by the U.S. military in its fight against Native Americans; and climate change on the Great Plains—a wet period up to the 1850s followed by 30 years of drought—combined with overhunting by Native Americans. But recent research has uncovered a new reason that dominates all others for the slaughter of the buffalo: an invention in London circa 1871 that allowed the buffalo hides to be tanned for industrial use (such as for belts), creating a huge demand from Europe for the hides.18 As a result, the price of hides increased in America, and the vast majority of untanned hides were exported to Europe for use in industry.
398
An estimate of the import of untanned hides from the United States to the United Kingdom and France is shown in Figure 11-6. These estimates come from comparing import demand in the United Kingdom and France with demand in Canada, where the invention allowing buffalo hides to be tanned for industrial use was not known. We are therefore looking at the extra demand in the United Kingdom and France after the invention was put to use. We can see from Figure 11-6 that the amount of imports into these countries (in excess of imports into Canada) was small or negative before 1871, but then grew rapidly and peaked in 1875. That year the United Kingdom and France combined imported more than 1 million hides and, over the entire period from 1871 to 1878, imported some 3.5 million hides, which can plausibly account for the slaughter of the entire Great Plains herd.19 A further slight increase in imports in the 1880s likely reflects hides from the Northern herd of buffalo in the United States.
399
Figure 11-6 shows convincingly that international trade, combined with the innovation in tanning technology in London and the absence of any property rights over the buffalo, was responsible for the slaughter of the buffalo. That is a sad result of market forces and one that we want to avoid today through agreements such as CITES. We now turn to two final examples of trade policy cases being discussed in the world today that have environmental implications. In contrast to the slaughter of the buffalo or the overharvesting of fish, it is more challenging in these final examples to determine the social costs or benefits of international trade.
Trade in Solar Panels In Chapter 9, we discussed the production and export of solar panels. When consumers install solar panels there is a positive consumption externality, because this source of electricity does not rely on the burning of fossils fuels, which emits carbon and contributes to global climate change. In terms of Figure 11-4 panel (b), the SMB curve would be drawn above the demand curve rather than below it. Free trade in solar panels would lead to an extra social gain, because with increased Home consumption of solar panels, the benefit from the consumption externality grows. There would be two sources of gains from trade: the private gains from trade (area b), and an extra area of social gains (like area d, but measured with SMB drawn above the D curve).
In principle, the extra social gains that come from free trade are even larger when one country subsidizes the production of solar panels and exports more panels at lower prices. That is what the United States and the European Union (EU) believe that China has done. But rather than accept the low-priced solar panels, with the positive consumption externality, these countries have threatened to apply tariffs against China. Why are these countries not willing to import solar panels at the lowest possible price and in this way get the greatest social gain from not burning fossil fuels, as environmentalists would prefer?
There are two answers to this question. The first is that the positive consumption externality from using solar panels is a global externality: using sunshine rather than fossil fuel generates fewer carbon emissions and therefore reduces the risks from global climate change. Because this benefit applies to everyone on the globe and not just to one nation’s population, an importing country might not be willing to accept low-priced solar panels when the social benefits are so diffuse, particularly when the imported low-price solar panels threaten local producers.
The second related reason comes from the competitive threat to Home producers from the low-priced imports. In addition to the political pressure to help Home producers, the governments of the United States and the EU might believe that maintaining this industry at Home has spillover benefits to other American and European industries. In other words, U.S. and European policy makers might believe that there is a positive production externality in manufacturing solar panels, because that manufacturing will lead to knowledge that can be applied elsewhere. The difficulty for policy makers is to correctly identify the extent of these potential knowledge spillovers, especially compared with the social benefits from using solar panels. Put simply, is it more important to encourage knowledge spillovers by protecting the solar panel industry in the U.S. and EU through tariffs, or to encourage the greatest use of solar panels in these countries by allowing low-price imports from China? That is the dilemma faced by the United States and the EU with regard to the imports of solar panels from China.
400
Trade in Rare Earth Minerals In Chapter 10, we discussed policies used by China in its export of rare earth minerals. During 2009–11, China used export quotas to restrict the sale of these minerals, leading to higher world prices. As a result, a mine was opened in Australia and a mine in the Mojave Desert of the United States was re-opened. The U.S. mine had been closed in 2002 because of a spill of radioactive fluid from a pipeline. Rare earth minerals are often found in the presence of radioactive elements such as thorium and uranium, so the processing of these minerals leads to low-grade radioactive waste. It is this by-product of the processing of rare earth minerals that leads to environmental concerns. The ore from the Australian mine is processed in Malaysia, leading to worry in that country about the safe handling of the radioactive waste: see Headlines: China Signals Support for Rare Earths, in Chapter 10. Other countries that have deposits of these minerals include Greenland (as discussed in the beginning of Chapter 1) and some African countries.
Regardless of the country in which they are processed, the processing of rare earth minerals has a negative production externality, as we examined in panel (a) of Figure 11-4. It would be difficult to limit the amount demanded of these minerals, because they are used in so many high-tech products. So from an environmental point of view, the most important matter is to regulate the disposal of the radioactive by-product.
China has begun to make efforts in that direction, as discussed in the Headlines article in Chapter 10. But as a newly industrialized country, China does not have the same level of environmental regulation as found in the United States or Australia. We can expect the processing activities of the mines in the Mohave Desert to be closely monitored, especially the treatment of the radioactive waste. But it is troubling that the company that owns the mine in Australia, Lynas Corporation, has chosen to process the ore in Malaysia. That concern has led to the protests of activists in Malaysia (as discussed in Chapter 10). Similar to the policies that ensure the safety of workers discussed earlier in this chapter, monitoring the disposal of radioactive waste from rare earth minerals will probably involve a combination of consumer protests, corporate responsibility, and government policies across countries.
International Agreements on Pollution
Pollution is a by-product of many manufacturing activities. The tragedy of the commons applies to pollution, too, because companies and countries can treat the air and water as a common-property resource, allowing pollutants to enter it without regard for where these pollutants end up. Pollution is an international issue because it can often cross borders in the water or atmosphere. We will use the term “global pollutants” for substances that cross country borders. Examples include chlorofluorocarbons (CFCs), which result in a depletion of the ozone layer in the atmosphere, and carbon dioxide (CO2), which contributes to global warming. In contrast, we use the term “local pollutants” for substances that, for the most part, stay within a country. An example is smog, which is caused by the carbon monoxide in factory emissions and automobile exhaust.
401
Challenge the students to think of global warming as a prisoner's dilemma problem.
Global Pollutants For global pollutants, a prisoner’s dilemma similar to that illustrated in Figure 11-2 for tariffs again applies. Because the pollution crosses international borders, each country does not face the full cost of its own pollution. It follows that there is little incentive to regulate global pollutants. In the absence of regulation, however, countries will end up with the bad outcome of having too much global pollution, so international agreements are needed to control the amount.
Payoff Matrix To make this argument more carefully, in Figure 11-7 we show the payoff matrix for two countries, each of which decides whether to regulate the emissions of a pollutant. The regulations could take the form of limits on how much of the pollutant an industry can emit, which means that the industry must install special equipment to reduce its emissions, at its own expense. Each quadrant of the matrix includes Home’s payoff in the lower-left corner and Foreign’s payoff in the upper-right corner. We start with a situation of regulation and then measure the change in welfare for Home or Foreign when there are no pollution regulations (or when pollution regulations are not enforced).
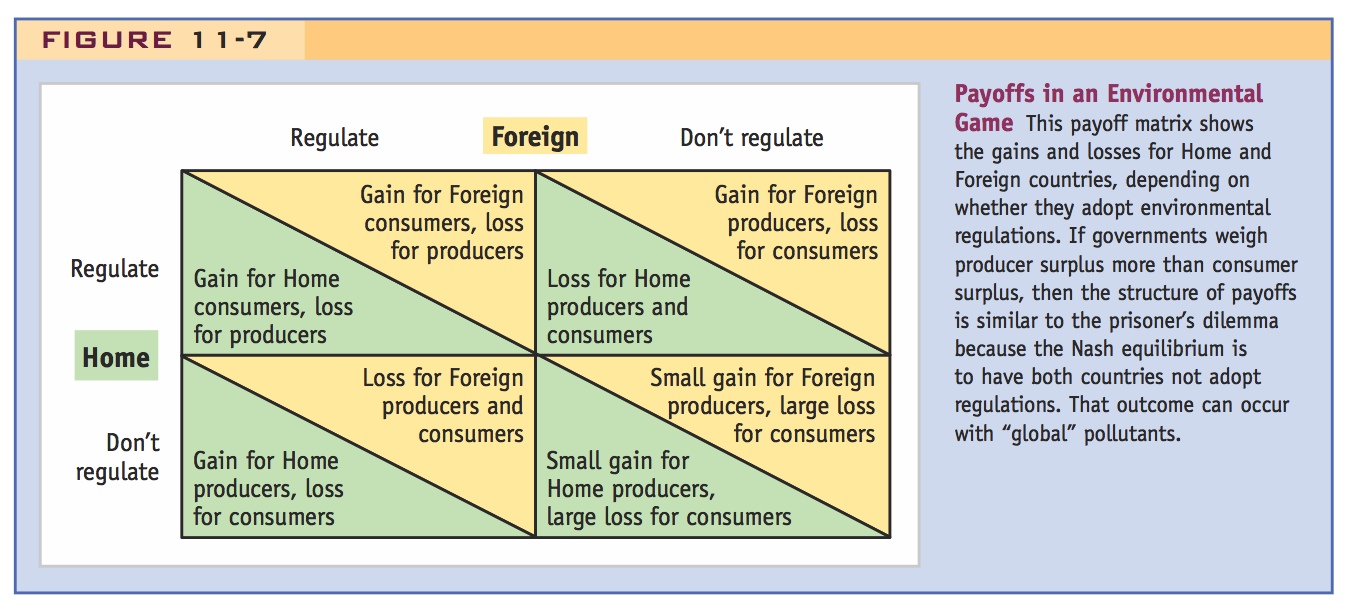
Starting in the upper-left cell, when both countries regulate emissions of the pollutant, consumers are better off as compared with no regulations, while producers are worse off because of the expense of the regulations. If one country—say, Home—decides not to regulate, then its producers would gain because they no longer have to install the extra equipment to reduce emissions, but consumers in Home and Foreign would lose if regulations are not used because of the extra pollution. The outcome is similar if Foreign decides not to regulate: its producers gain, and consumers in both countries lose. Finally, if neither country regulates, then there is a large loss for consumers from the extra pollution and a small gain for producers due to the cost savings from not installing the equipment (this gain is small because neither producer is subject to the regulations, so competition can eliminate most of their gains).
Nash Equilibrium Let us use the structure of payoffs in Figure 11-7 to determine the Nash equilibrium. Start in the upper-left quadrant, where both countries regulate their pollution emissions. If either country deviates from this position and does not regulate, it will experience a gain for producers and a loss for consumers. If pollution is local, then the country might realize that the costs to consumers outweigh the gains to producers. That is why the Environmental Protection Agency (EPA) in the United States regulates the pollution from factories and from cars: the gains to consumers from reducing pollution outweigh the costs to producers.
402
In the case of global pollution, however, this calculation changes. If a country’s pollution crosses international borders, as with CO2 emissions, then the perceived gains to a country’s own consumers from regulating the pollution may be less than the costs to producers. In that case, neither country will want to stay in the regulated quadrant in the upper left of Figure 11-7 and will have an incentive not to regulate its global pollution. Given that one country does not regulate its global pollution, the other country will have an even greater incentive not to regulate: if Home does not regulate in Figure 11-7 so that we are in the bottom row, then Foreign’s best decision will likely be not to regulate either because the additional loss to its consumers will be offset by a gain to producers.20
Thus, the payoffs shown in Figure 11-7 can lead us to a situation in which neither country regulates pollution, in the lower-right quadrant, despite the large losses to consumers. That outcome is similar to the prisoner’s dilemma that we discussed for the tariff game (Figure 11-2): both countries can end up with a bad outcome (with high tariffs or high pollution), even though they are individually making their best decisions. Just like the tariff game, multilateral agreements are needed to ensure that countries end up instead in the upper-left quadrant, with both countries regulating the global pollution.
From which we draw the moral that Kyoto and Copenhagen are commitment mechanisms. Except that no one wants to commit.
Multilateral Agreements One example of an international agreement is the Montreal Protocol on Substances that Deplete the Ozone Layer, which has successfully eliminated the use of CFCs. In that case, the scientific evidence showing that CFCs were creating a “hole” in the ozone layer above Australia and New Zealand was conclusive. In addition, the CFCs that were used in refrigerators, air conditioners, and other appliances could be replaced with alternative chemicals at relatively low cost. So it was not that difficult to get all countries to agree to a ban on the use of CFCs, which began in 1989 and has already reduced the damage to the ozone layer. A more difficult case is that of global warming, which is regulated by an agreement known as the Kyoto Protocol, and more recently by the Copenhagen Accord, as discussed in our final application.
160 countries agreed to Kyoto, but the U.S. refused to ratify it. Why? One big reason: developing countries did not join, so—as in the prisoner’s dilemma—there was less incentive for the U.S. to join. Failure of new negotiations in Copenhagen.
This is yet another great topic for class discussion.
The Kyoto Protocol and the Copenhagen Accord
In December 1997, representatives from many nations met in Kyoto, Japan, to discuss nonbinding targets for reducing emissions of greenhouse gases. The principal greenhouse gas is CO2, which is released by cars, factories, home heating, the generation of electricity through coal plants, and basically nearly every activity that involves combustion. CO2 creates a “greenhouse” effect, whereby heat is trapped inside the atmosphere, slightly increasing the earth’s temperature. Even small increases in temperature can have dramatic consequences through the melting of ice caps, which raises the level of oceans; changes weather patterns; affects agriculture, tourism, and other economic activities; endangers species; and may have even worse consequences.
403
The Kyoto Protocol built on the United Nations’ 1992 treaty on climate change, which was ratified by 189 countries, including the United States. Five years later, in 1997, the Kyoto Protocol established specific targets for reduction in greenhouse gas emissions: the industrial countries should cut their emissions of greenhouse gases by a collective 5.2% less than their 1990 levels (which is estimated to be a reduction of 29% from what 2010 levels are predicted to occur without the agreement). Targets for individual countries range from an 8% reduction for the European Union, 7% for the United States, 6% for Japan, 0% for Russia, and permitted increases for Australia and Iceland. In addition, a market for emissions targets was established so that Russia, for example, could sell its credits to other countries if it produces less than its 1990 level of greenhouse gases.
More than 160 countries have ratified this agreement, including about 40 industrial countries. Russia ratified the treaty on November 18, 2004, bringing the amount of greenhouse gases accounted for by the members to more than 55% of the world total. The treaty then took effect three months later, on February 16, 2005. However, the United States did not ratify this treaty and is the only large industrial country not to join the effort. Why did the United States refuse to join, and what actions can be taken instead to reduce global emissions?
There are four reasons often given to explain why the United States did not join the Kyoto Protocol:21 (1) although the evidence toward global warming is strong, we still do not understand all the consequences of policy actions; (2) the United States is the largest emitter of greenhouse gases and meeting the Kyoto targets would negatively affect its economy; (3) Kyoto failed to include the developing countries, especially China and India; (4) there are other ways to pursue reductions in greenhouse gas emissions.
The first point has become less plausible over time, as the evidence for and consequences of global warming become more apparent. The second point is true: the United States is the largest emitter of greenhouse gases (because of its very large economy), and meeting the Kyoto goals would certainly impose significant costs on the economy. The costs to the United States would probably be higher than the costs to Germany, for example, because East Germany had plants that were highly polluting in 1990 that have now been shut down. The percentage reduction in German pollution is calculated from a baseline that includes the highly polluting plants, whereas the percentage reduction in the United States is calculated from a baseline using plants that were already polluting less in 1990, due to U.S. regulations.
Nevertheless, the fact that costs are high should not prevent countries from trying to reduce greenhouse gas emissions. A 2006 report by the Stern Commission in the United Kingdom argues that the costs of not reducing greenhouse gas emissions are unacceptably high: as high as “the great wars and the economic depression of the first half of the twentieth century” and damage from climate change that is potentially irreversible.22
404
The third point—that the Kyoto Protocol leaves out developing countries such as China and India—is perhaps the major reason why the United States did not ratify the treaty. Just as in the prisoner’s dilemma game illustrated in Figure 11-7, if one player does not regulate its emissions, then there is less incentive for the other player to also regulate. For this reason, the Copenhagen Climate Summit, held in Copenhagen in December 2009, brought together all the major countries with an interest in climate change—119 nations in total—to try and hammer out a new agreement. Unfortunately, the meeting ended with only modest goals, called the Copenhagen Accord: a recognition that further increases in global average temperature should be kept below 2 degrees centigrade; an agreement that industrialized countries will submit goals for greenhouse gas emissions reductions, while developing countries will communicate their efforts in this regard; and the establishment of a fund to finance the needs of developing countries in fighting the effect of climate change. But as indicated in Headlines: Dismal Outcome at Copenhagen Fiasco, these goals come without any firm means to enforce them.
Article in FT describing the failure in Copenhagen
Dismal Outcome at Copenhagen Fiasco
In the introduction to the chapter, we discussed the Copenhagen Climate Summit, held in December 2009, which was intended to establish new guidelines for reductions in greenhouse gas emissions. The summit did not achieve that goal, unfortunately, and this article discusses possible next steps.
The [Copenhagen Accord] agreement cobbled together by the US, China, India, Brazil and South Africa is merely an expression of aims. It recognises the scientific case for keeping the rise in global temperatures to 2°C. It calls on developed countries to provide $100 [billion] a year in support of poor nations’ efforts by 2020, but without saying who pays what to whom. It appears to commit none of the signatories to anything.
…Climate change requires global cooperation, to be sure, because the global stock of greenhouse gases is the driver. Collective action is essential. The free-rider problem is obvious and has to be addressed. But the maximalist approach to this, a global treaty with binding caps on emissions, is going to be extraordinarily difficult to achieve. Even if the will were there, enforcing the caps would be a problem, as the Kyoto Protocol amply attests. If the maximalist model can be revived in time for next December’s [2010] scheduled conference in Mexico, well and good: the key thing, though, is that progress should not be held hostage to it. The need is for greater pragmatism and flexibility.
The US and China can take the lead. In Copenhagen, friction between the two was evident, with the US calling for independent verification of emissions reductions, and China resisting infringements of its sovereignty. In fact the two countries are not so far apart: the US Congress is as jealous of national sovereignty, and as wary of international obligations, as China. Both countries should lead by example, with unilateral low-cost carbon-abatement policies already announced or under consideration: cap and trade in the US, measures to reduce carbon intensity in China. The international framework need not insist on lock-step agreement. Above all, it should not obstruct policies that push the right way….
Generous aid to developing countries for greenhouse gas abatement is warranted, but should be negotiated separately. Again, the need is to unpack the problem into manageable pieces. Copenhagen has shown the limits to the current approach. Reviving international co-operation is of paramount importance. This can best be done by asking less of it.
Source: Lex Team, “Dismal outcome at Copenhagen fiasco,” Financial Times, December 20, 2009. From the Financial Times © The Financial Times Limited 2009. All Rights Reserved.
The Headlines article recognizes that action on global climate change requires global cooperation. But the multilateral deal that was attempted at Copenhagen is not the only way to go. Countries can and should pursue domestic policies that limit greenhouse gas emissions. Europe already has a well-functioning market for carbon emissions, which allows companies and countries to buy and sell credits for such emissions. The United States is considering the same type of market under a “cap and trade” system, which puts a cap (upper limit) on the carbon emissions of each firm, but allows them to trade credits with other firms. Although China does not yet envisage such a system, it is making another type of contribution by focusing on alternative energy, becoming the world’s largest producer and exporter of solar panel cells and wind turbines. Furthermore, in March 2010, China and India agreed to join the Copenhagen Accord, as has the United States and more than 100 other countries. These actions show that the modest goals of the Copenhagen Accord have made it easier for countries to join that agreement than the earlier, binding limits of the Kyoto Protocol. Even though this accord does not include a means of enforcement, it could form the basis for future international cooperation on climate change.