PROBLEMS
Question 12.1
1. The data in Table 12-1 end in 2011. Visit the U.S. Bureau of Economic Analysis at bea.gov to find information for the latest full calendar year (or for the last four quarters). What is the latest estimate of the size of the annual U.S. current account deficit in billions of dollars?
Question 12.2
2. The data in Figure 12-1 end in 2012. Visit oanda.com (or another site with daily exchange rate data) and download data on the same exchange rates (yuan per dollar and dollar per euro) for the past 12 months. What are the rates today? What were they a year ago? By what percentage amount did the rates change? Do you think the rates are floating or fixed? Why?
Question 12.3
3. The data in Figure 12-3 end in the year 2011. Find the IMF’s World Economic Outlook Databases. (Hint: Try searching “world economic outlook databases.”) Use this interactive tool to obtain the latest data on current accounts in U.S. dollars for all countries (actual data or IMF estimates). Which countries had the 10 largest deficits last year? Which countries had the 10 largest surpluses last year?
Question 12.4
4. Visit the Financial Times website (at ft.com click on “Market data”) to download data for country risk today. (Hint: Try searching “FT high-yield emerging markets.”) Which three emerging market countries have the highest spreads on their U.S. dollar debt? Which three have the lowest?
Question 12.5
5. The map at the end of the chapter shows the World Bank’s composite governance indicator. The World Bank has prepared other indicators to measure institutional differences among countries. Use the Internet to find the World Bank’s “Ease of Doing Business Map.” (Hint: Again, try an Internet search.) Do you notice a correlation between the ease of doing business and the overall governance indicator? Can you find countries that rank high on the Ease of Doing Business indicator but low on the governance indicator? Are these countries rich or poor? (Hint: Look up their GNI per person at the World Bank by searching “world bank GNI per capita.”)
Question 12.6
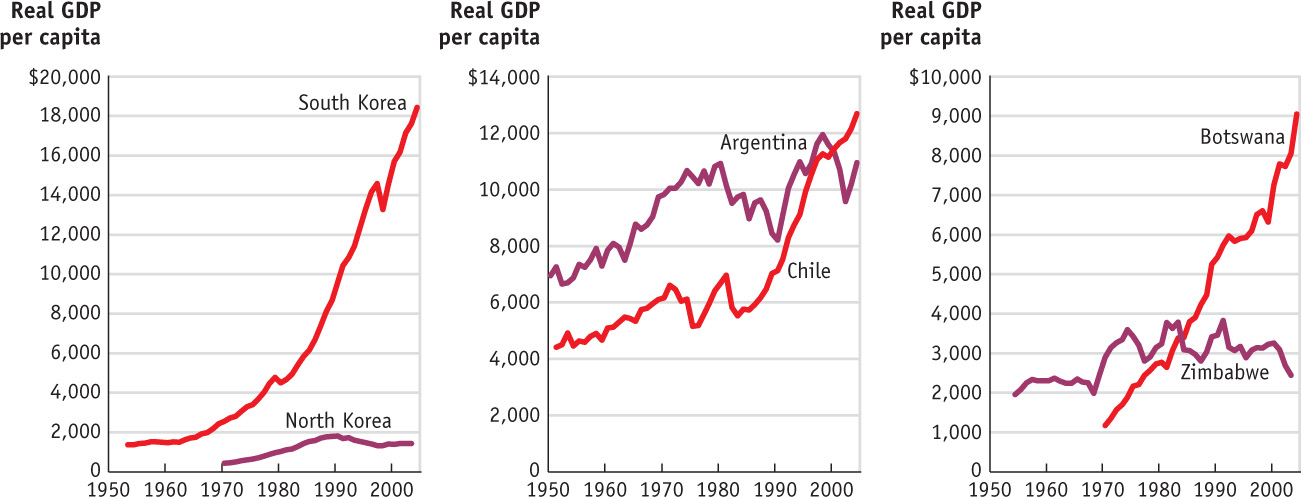
6. The charts on page 23 show the growth of real GDP per capita in three pairs of geographically adjacent countries: North and South Korea, Argentina and Chile, Zimbabwe and Botswana (using data from the Penn World Table).
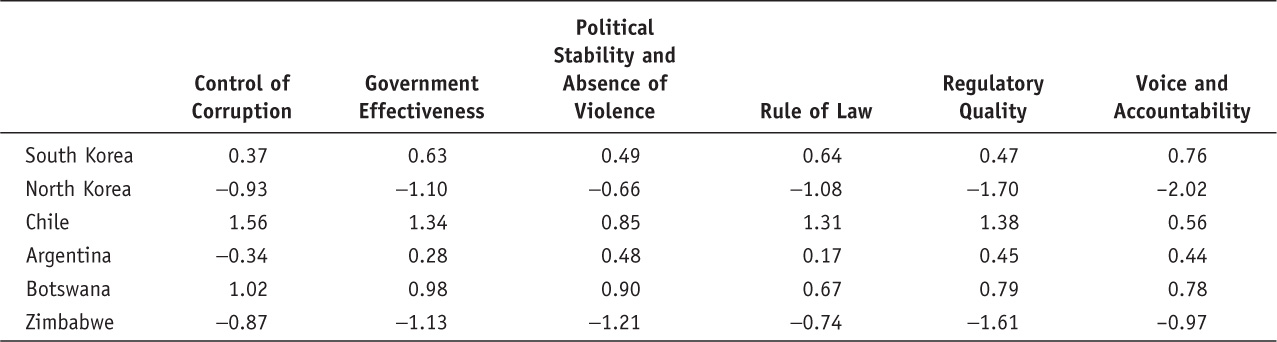
(a) Which country in each pair experienced faster growth in GDP per capita? Which one is now richest? (b) The World Bank’s World Governance Indicators for each country in 2000 were as shown in the table above (higher is better):Based on these data, do you think institutions can explain the divergent outcomes in these countries? Explain. Why do you think it helps to compare countries that are physically contiguous?
Question 12.7
7. Visit one of the many websites that lists all of the current exchange rates between different currencies around the world. Try a financial newspaper’s site such as ft.com (follow the links to “Market Data,” and then “Currencies”), or try websites devoted to foreign exchange market data such as oanda.com or xe.com (dig down; don’t just look at the major currency tables). According to these lists, how many distinct currencies exist around the world today? Are some currencies used in more than one country?
23
24