1 Exchange Rate Essentials
The exchange can be quoted in units of the domestic currency per unit of the foreign, or vice versa.
1. Defining the Exchange Rate
Here the nominal exchange rate E is defined as the relative price of foreign currency in terms of domestic currency. For example, the U.S. exchange against the euro, E$/€, is measured in dollars per euro. This could be expressed in European terms as E€/$, which is in euros per dollar.
2. Appreciations and Depreciations
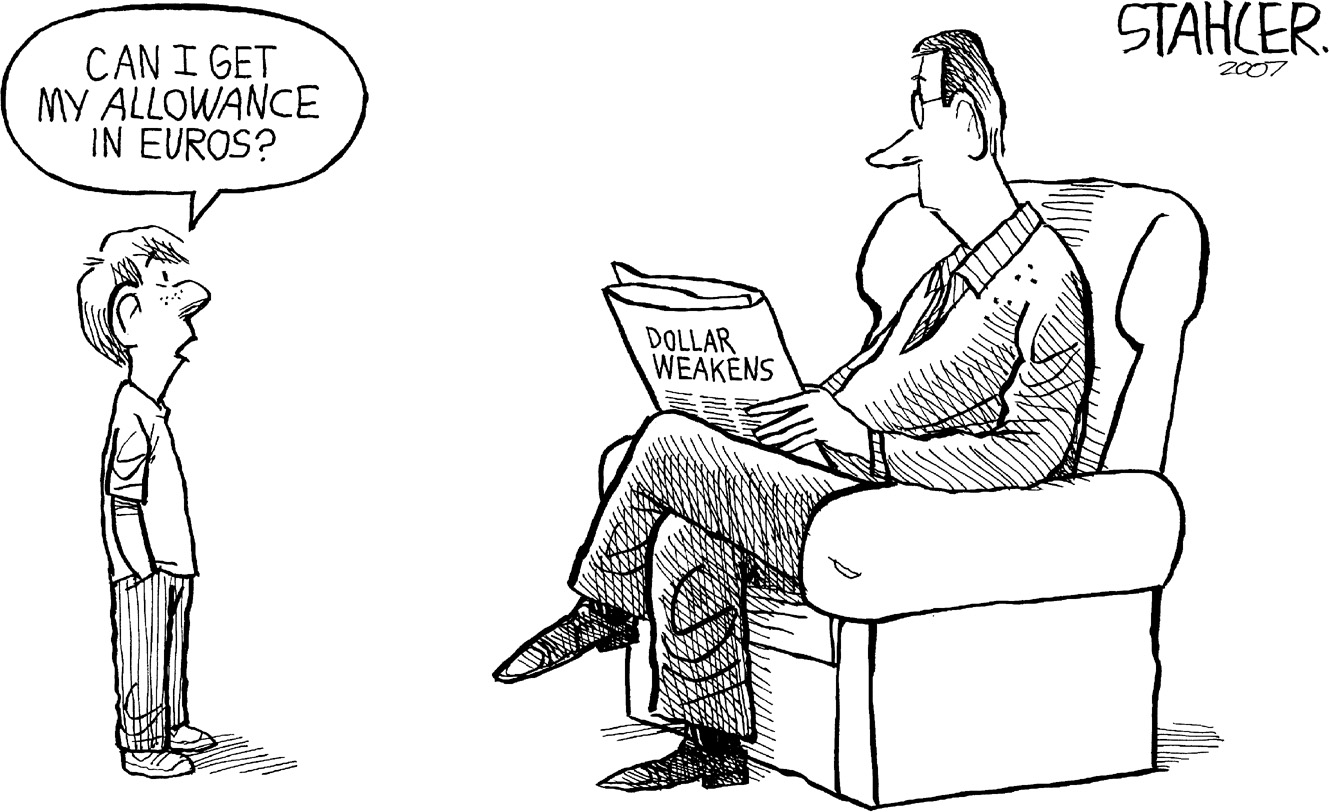
A currency appreciates (depreciates) if its value increases (weakens) relative to another currency. So if E$/€ increases the euro has appreciated and the dollar has depreciated; if E$/€ decreases the euro has depreciated and the dollar has appreciated. Changes in exchange rates are often expressed in percentages, that is, as rates of appreciation or depreciation.
3. Multilateral Exchange Rates
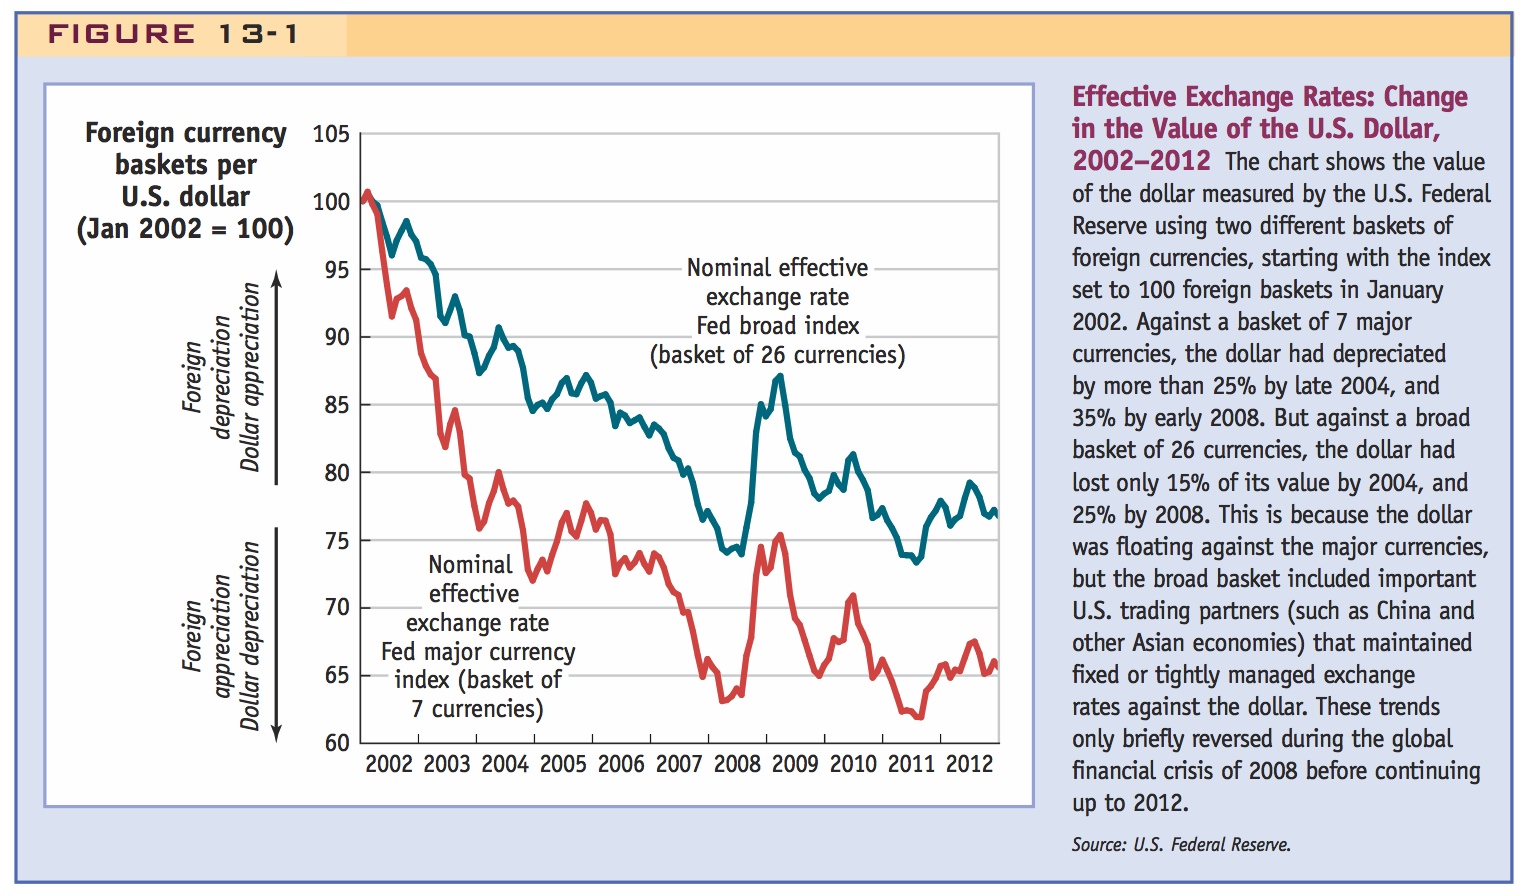
These were bilateral exchange rates. To assess if the currency is appreciating or depreciating overall against many currencies we need a multilateral exchange. The effective exchange rate is a trade-weighted average of a basket of bilateral exchange rates. Real world example: Since 2002 the dollar has depreciated relative to the euro, pound, Canadian dollar, and Swiss franc. However, it has not depreciated as much relative to all U.S. trading partners because China and Japan were intervening to dampen the appreciation of their currencies.
4. Example: Using Exchange Rates to Compare Prices in a Common Currency
James Bond needs to compare prices of suits in London, New York, and Hong Kong. Emphasize the importance of assuming that nominal prices (in domestic currency) of goods in each country haven’t changed: Prices are sticky in the short run.
a. Generalizing. Assuming prices in each country don’t change, then changes in nominal exchange rates alter the relative prices of foreign goods expressed in domestic currency; they also change the relative prices of goods produced in both countries. An appreciation (depreciation) of the Home economy makes its exports more (less) expensive, and its imports less (more) expensive on world markets.
Get students in the habit of thinking about the units in which things are measured.
An exchange rate (E) is the price of some foreign currency expressed in terms of a home (or domestic) currency. Because an exchange rate is the relative price of two currencies, it may be quoted in either of two ways:
- The number of home currency units that can be exchanged for one unit of foreign currency. For example, if the United States is considered home, the dollar–euro exchange rate might be $1.15 per euro (or 1.15 $/€). To buy one euro, you would have to pay $1.15.
- The number of foreign currency units that can be exchanged for one unit of home currency. For example, the 1.15$/€ exchange rate can also be expressed as €0.87 per U.S. dollar (or 0.87 €/$). To buy one dollar, you would have to pay €0.87.
Knowing the format in which exchange rates are quoted is essential to avoid confusion, so we now establish a systematic rule, even if it is arbitrary.
Defining the Exchange Rate
Students do find this confusing. Emphasize that E is the price of the foreign currency in terms of domestic, rather than the converse. Say that it is the convention in most, but not all, texts and that looking at data it is essential to keep track of which definition is being used.
It is common practice to quote the prices of items traded, whether goods or assets, as units of home currency per unit purchased. In the United States, coffee might be sold at 10 dollars per pound ($/lb); in France, at 20 euros per kilogram (€/kg).1
The usual way to quote the price of foreign currency is no different: units of home currency per unit of foreign currency. Confusion may arise because the price then depends on the perspective of the observer. Consider the dollar–euro exchange rate. For the U.S. citizen, who is accustomed to prices expressed as $/unit, the price of a foreign currency (say, the euro) is in terms of $/€. For someone in the Eurozone, however, the convention is to quote prices as €/unit, so €/$ would be the natural choice.
To avoid confusion, we must specify which country is the home country and which is foreign. Throughout the remaining chapters of this book, when we refer to a particular country’s exchange rate, we will quote it in terms of units of home currency per unit of foreign currency. For example, Denmark’s exchange rate with the Eurozone is quoted as Danish krone per euro (or kr/€).
27
From now on, E1/2 will denote the exchange rate in units of country 1 currency per unit of country 2 currency; it is the rate at which country 1’s currency can be exchanged for one unit of country 2’s currency. For example, E$/€ is the U.S. exchange rate (against the euro) in U.S. dollars per euro. In our previous example, E$/€ was 1.15 $/€.
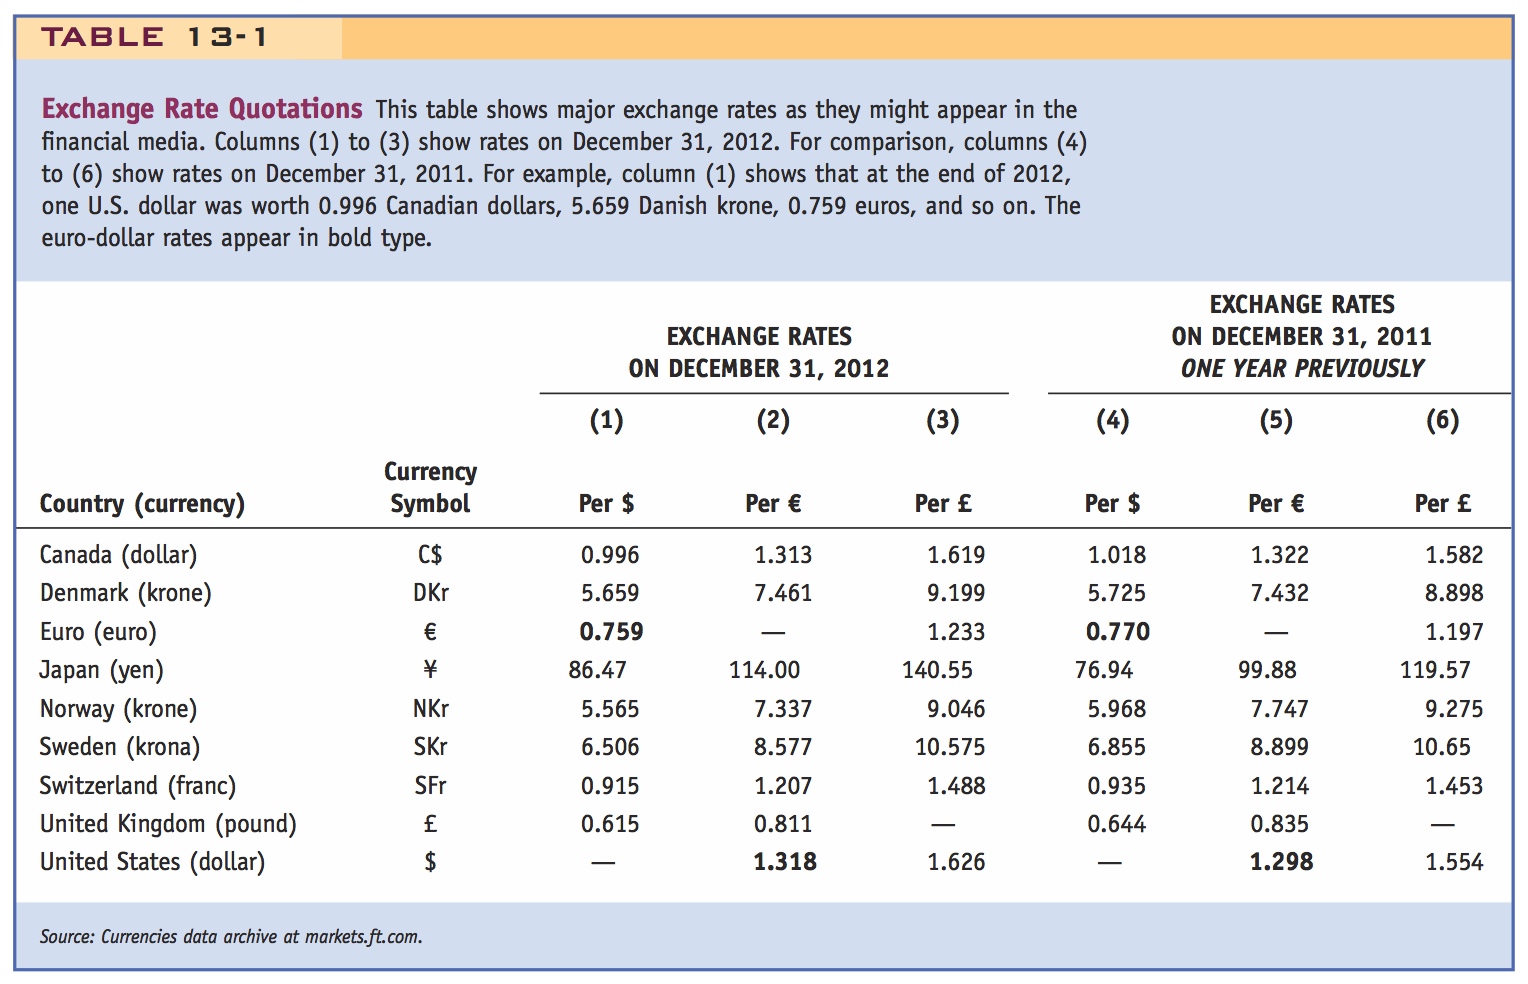
We see different expressions of the same exchange rate all the time—even on the same page in the same publication! So it is important to keep things straight. Table 2-1 presents a typical display of exchange rate information as one might see it in the financial press.2 Column (1) shows the reported price of U.S. dollars in various currencies (e.g., €/$); columns (2) and (3) show, respectively, the price of euros (e.g., $/€) and British pounds sterling (e.g., $/£) on the publication date of December 31, 2012.3 Thus, the first three entries show the Canadian dollar’s exchange rate against the U.S. dollar, the euro, and the pound. For comparison, columns (4) to (6) show the same rates one year earlier.
28
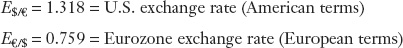
The four bold entries in this table correspond to the dollar–euro exchange rate. On December 31, 2012, for example, the euro was quoted at $1.318 per euro. According to our definition, this is the price from the U.S. perspective and it is sometimes called the American terms. Conversely, the dollar is quoted at €0.759 per dollar, the European terms.
We write these exchange rates using mathematical symbols as follows, with care given to the explicit expression of the relevant units:
Interpret this: it says how many dollars you have to get a euro . . .
. . . while this says how many euros you have to give up to get a dollar. Make it concrete.
Just as there is complete equivalence when we express the relative price of coffee and dollars at 10 $/lb or 0.1 lb/$, the price of the euro in terms of dollars always equals the reciprocal (or inverse) of the price of dollars in terms of euros. Hence,

In our example,

Similar calculations and notations apply to any pair of currencies.
Appreciations and Depreciations
Like many financial tables, Table 2-1 includes information on how prices have changed over time. Over the previous 12 months, the Eurozone exchange rate decreased from E€/$ = 0.770 a year before to E€/$ = 0.759 on December 31, 2012. The value of the euro relative to the dollar went up—fewer euros were needed to buy one dollar. This change is often described by saying that the euro got “stronger” or “strengthened” against the dollar.
Symmetrically, the value of the dollar in euro terms also changed. We see this by computing the reciprocal American terms. Over the same year, the U.S. exchange rate increased from E$/€ = 1/0.770 = 1.298 a year before to E$/€ = 1/0.759 = 1.318 on December 31, 2012. The value of the dollar relative to the euro went down—more dollars were needed to buy one euro. This change is often described by saying that the dollar got “weaker” or “weakened” against the euro.
At this point you might also introduce the terminology of devaluation and revaluation, even though you haven't defined fixed rates yet.
If one currency buys more of another currency, we say it has experienced an appreciation—its value has risen, appreciated, or strengthened. If a currency buys less of another currency, we say it has experienced a depreciation—its value has fallen, depreciated, or weakened.
In our example, we can understand appreciation and depreciation from both the U.S. and European perspective; this lesson generalizes to all other currency pairs.
In U.S. terms, the following holds true:
Students instinctively want to interpret an appreciation of the dollar as an INCREASE in E. Remind them that E is the price of the euro, not the dollar.
- When the U.S. exchange rate E$/€ rises, more dollars are needed to buy one euro. The price of one euro goes up in dollar terms, and the U.S. dollar experiences a depreciation.
- When the U.S. exchange rate E$/€ falls, fewer dollars are needed to buy one euro. The price of one euro goes down in dollar terms, and the U.S. dollar experiences an appreciation.
29
Similarly, in European terms, the following holds true:
- When the Eurozone exchange rate E€/$ rises, the price of one dollar goes up in euro terms and the euro experiences a depreciation.
- When the Eurozone exchange rate E€/$ falls, the price of one dollar goes down in euro terms and the euro experiences an appreciation.
If the dollar is appreciating against the euro, the euro must simultaneously be depreciating against the dollar. Because they are the reciprocal of each other, changes in E$/€ and E€/$ must always move in opposite directions.
It may seem confusing or counterintuitive that a fall in the U.S. exchange rate means the dollar is appreciating. Yet it is reasonable because we express the price of foreign currency in dollars, just as we express the prices of other goods. When the price of coffee falls from $10 to $9 per pound, it seems sensible to say that coffee is depreciating or falling in value—but relative to what? The dollars—the currency in which the price is denominated. Conversely, dollars are appreciating against coffee because it takes fewer dollars to buy the same amount of coffee! If we keep this analogy in mind, it makes sense that when the dollar price of a euro falls, the dollar has appreciated against the euro.
In addition to knowing whether a currency has appreciated or depreciated, we are often interested in knowing the size of an appreciation or depreciation. To do this, we can calculate the proportional or fractional change in the foreign-currency value of the home currency. This proportional change is usually expressed in percentage terms.
In the previous example, we would describe these changes as follows:
- In 2011, at time t, the dollar value of the euro was E$/€,t = $1.298.
- In 2012, at time t + 1, the dollar value of the euro was E$/€,t+1 = $1.318.
- The change in the dollar value of the euro was ΔE$/€,t = 1.318 − 1.298 = +$0.020.
- The percentage change was ΔE$/€,t/E$/€,t = +0.020/1.298 = +1.54%.
- Thus, the euro appreciated against the dollar by 1.54%.
Similarly, over the same year:
Again, it is important to make this concrete. Go to a site like the St. Louis Fed's International Economic Trends and have the students describe the time series behavior of several bilateral rates.
- In 2011, at time t, the euro value of the dollar was E€/$,t = €0.770.
- In 2012, at time t + 1, the euro value of the dollar was E€/$,t+1 = €0.759.
- The change in the euro value of the dollar was ΔE€/$,t = 0.759 − 0.770 = −€0.011.
- The percentage change was ΔE€/$,t/E€/$,t = −0.011/0.770 = −1.43%.
- Thus, the dollar depreciated against the euro by 1.43%.
They will find this a bit confusing. Offer to meet those whose seek enlightenment on this question after class.
Note that the size of one country’s appreciation (here 1.54%) does not exactly equal the size of the other country’s depreciation (here 1.43%). For small changes, however, the opposing movements are approximately equal. For example, if the U.S. terms move slightly from $1.00 to $1.01 per euro, the European terms move from €1.00 to €0.99099; a 1% euro appreciation is approximately a 1% dollar depreciation.4
30
Multilateral Exchange Rates
Our discussion of exchange rates has focused on the simplest type of exchange rate between two countries or currencies, what economists refer to as a bilateral exchange rate. In reality, we live in a world of many countries and many currencies, and it is of great practical importance to ask whether a particular currency has strengthened or weakened not just against one other currency, but against other currencies in general.
The answer is not always obvious. It could, and very often is, the case that the U.S. dollar may be depreciating against some currencies, while remaining fixed or appreciating against others. To aggregate these different trends in bilateral exchange rates into one measure, economists calculate multilateral exchange rate changes for baskets of currencies using trade weights to construct an average of all the bilateral changes for each currency in the basket. The resulting measure is called the change in the effective exchange rate.
For example, suppose 40% of Home trade is with country 1 and 60% is with country 2; Home’s currency appreciates 10% against 1 but depreciates 30% against 2. To calculate the change in Home’s effective exchange rate, we multiply each exchange rate change by the corresponding trade share and then add up: (−10% · 40%) + (30% · 60%) = (−0.1 · 0.4) + (0.3 · 0.6) = −0.04 + 0.18 = 0.14 = +14%. In this example, Home’s effective exchange rate has depreciated by 14%.
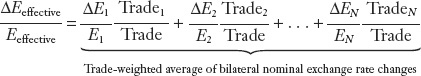
In general, suppose there are N currencies in the basket, and Home’s trade with the N partners is Trade = Trade1 + Trade2 + … + TradeN. Applying trade weights to each bilateral exchange rate change, the home country’s effective exchange rate (Eeffective) will change according to the following weighted average:
In class, go again to the St. Louis Fed (or any comparable source) and look at the U.S. effective rate from the early 1990s up to today. Point out the trend of depreciation since 2002, but also the appreciation during the crisis.
Many discussions among policy makers and within the financial press focus on the effective exchange rate. An especially contentious topic in the last decade has been the path of the United States’ effective exchange rate, shown in Figure 13-1. Since 2002, the U.S. dollar has steadily fallen in value against a basket of other currencies. It lost quite a lot of value against many well-known major currencies, such as the euro, the pound sterling, the Canadian dollar, and the Swiss franc. But on average, the weakening of the dollar was not as pronounced when measured against all U.S. trading partners. The simple reason for this was the fact that Japan and China, along with several other developing countries in Asia, sought to peg or control their exchange rates to limit their appreciation against the dollar. Thus, in the figure the downward trend for the broad basket of currencies is not as steep as that for the basket of seven major currencies.
This is a good example of the need to keep track of units of measurement, since this is 1/E.
31
Example: Using Exchange Rates to Compare Prices in a Common Currency
To make comparisons of prices across nations, we must convert prices to a common currency. The following examples show how we use exchange rates to accomplish this task.
My favorite example is of an Econ professor who is contemplating buying a suit in Italy. But come up with examples that will engage students interest. Or ask them for examples from their experience.
James Bond is back from another mission and, what with all the explosions and shootouts, his wardrobe is looking ragged. He needs a new tuxedo. Bond will be in numerous cities as part of Her Majesty’s Secret Service in the next few days, so he can shop around the globe. Although style is important, price is a key factor in Bond’s choice, given the meager MI6 clothing allowance. Should he visit a new tailor in Manhattan? Go back to his favorite cutter in Hong Kong? Or simply nip around the corner to Savile Row in London?
The London tailor sells a tux for £2,000; the Hong Kong shop is asking HK$30,000; and in New York, the going rate is $4,000. In the near future, when the decision must be made, these prices are fixed in their respective home currencies. Which tux will 007 choose?
32
To choose among goods priced in different currencies, Bond must first convert all the prices into a common currency; for this he uses the exchange rate (and a calculator disguised as a toothbrush). Table 2-2 shows the prices, in local currency and converted into pounds, under different hypothetical exchange rates.
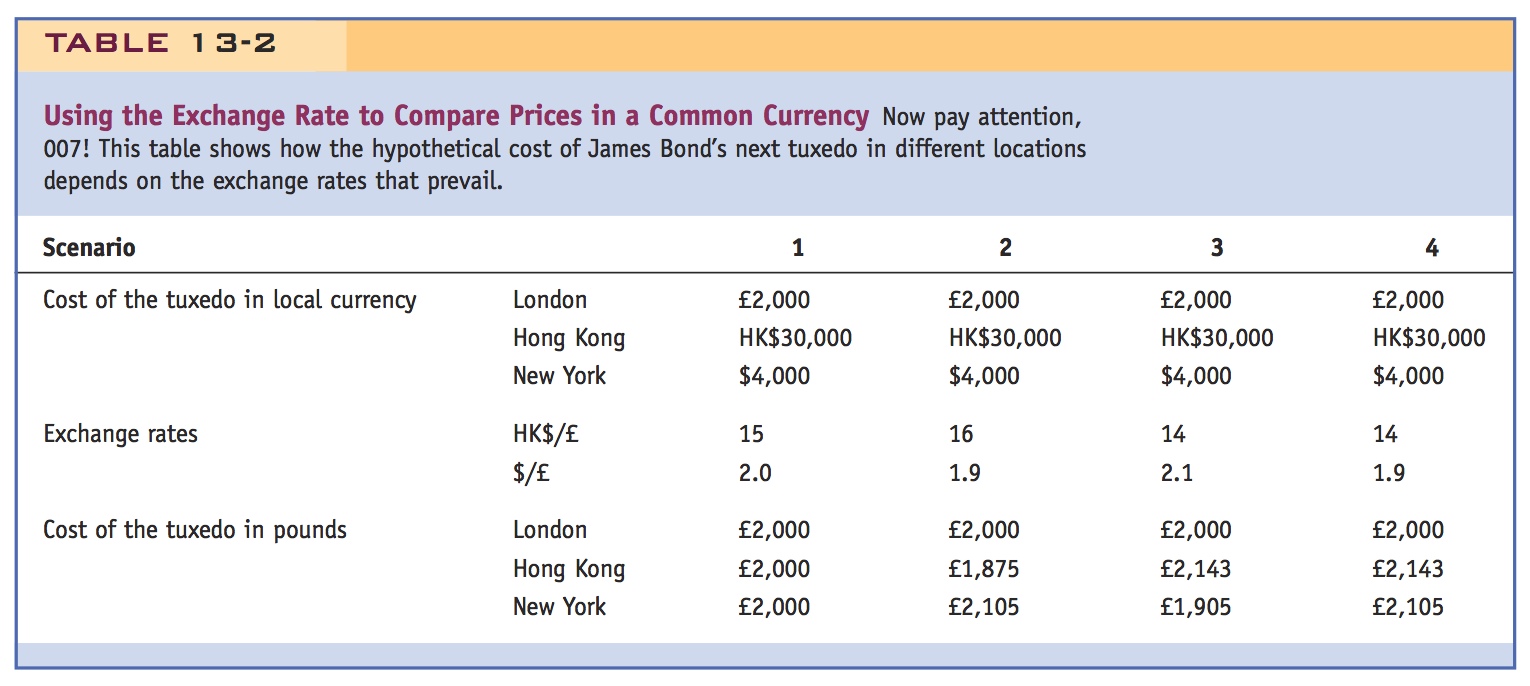
Scenario 1 In the first column, the Hong Kong suit costs HK$30,000 and the exchange rate is HK$15 per £. Dividing HK$30,000 by 15, we find that this suit costs £2,000 in British currency. The U.S. suit has a price of $4,000, and at an exchange rate of $2 per pound we obtain a British currency price of £2,000. Here the exchange rates are such that all prices are the same when measured in a common currency (pounds). Bond has a difficult choice.
Scenario 2 Moving to the next column, the Hong Kong dollar has depreciated against the pound compared with scenario 1: it takes more HK$ (16 instead of 15) to buy £1. In contrast, the U.S. dollar has appreciated against the pound: it takes fewer dollars (1.9 instead of 2.0) to buy £1. At the new exchange rates, the cost of the New York tux has gone up to £2,105 (4,000/1.9), and the Hong Kong tux has fallen to £1,875 (30,000/16). Hong Kong now has the lowest price.
Scenario 3 Compared with scenario 1, the Hong Kong dollar has appreciated: it takes fewer $HK to buy £1 (14 instead of 15), and the price of the Hong Kong tux has risen to £2,143 (30,000/14). The U.S. dollar, on the other hand, has depreciated: it takes more dollars (2.1 instead of 2) to buy £1. With the dollar’s depreciation, New York now has the best price of £1,905 (4,000/2.1).
Scenario 4 In this case, compared with scenario 1, the pound has depreciated against both of the other currencies, and they have each appreciated against the pound. It takes fewer Hong Kong dollars (14 instead of 15) and fewer U.S. dollars (1.9 instead of 2.0) to buy £1. Now London has the bargain price of £2,000 and the other cities have higher prices.
This is vital, but experience suggests students won't really understand what is going on here until the notion of the real exchange rate is introduced.
This example illustrates a key point. We assumed that while exchange rates may change, the prices of goods in each country are fixed in the short run (in domestic-currency terms). An economist would say the prices are sticky in the short run, and, as we see later, this is not an unreasonable assumption. Given that assumption, changes in exchange rates will cause changes in the common-currency prices of goods from different countries.
33
Generalizing The same logic applies to any exchange rate. All else equal, when the prices of goods are constant in each country, the following conclusions will apply:
- Changes in the exchange rate cause changes in prices of foreign goods expressed in the home currency.
- Changes in the exchange rate cause changes in the relative prices of goods produced in the home and foreign countries.
- When the home country’s exchange rate depreciates, home exports become less expensive as imports to foreigners, and foreign exports become more expensive as imports to home residents.
- When the home country’s exchange rate appreciates, home exports become more expensive as imports to foreigners, and foreign exports become less expensive as imports to home residents.