4 How Pegs Break II: Contingent Monetary Policies
First-generation models generated crises from “inconsistent” policies that could not be sustained. However, actual crises in the 1990s—like that of ERM—occurred to countries with sound macro policies. Second-generation models try to explain how crises can arise even if policies are rational and purposeful.
1. The Basic Problem: Contingent Commitment
If policymakers are not irrevocably committed to a peg, then speculators may bet against a currency precisely because they know the peg might be changed. Example: Britain in 1992. To maintain the peg it must raise its interest rates, pushing it into recession. Consider two scenarios. (1) German and British interest rates are low, so the output costs of the peg are low. The peg is credible, so speculators leave it alone. (2) Interest rates are high, so the output costs to Britain are high. Speculators know Britain will be tempted to abandon the peg, so they bet against it. Maintaining the peg exhausts reserves, which induces even more speculation against the pound, creating a currency crisis. In both cases, the ex ante expectations are validated ex post.
2. A Simple Model
Use the sticky-price IS-LM-FX model. The benefit from pegging b > 0 is constant; the cost is the deviation of income from full employment. There is an adverse demand shock from abroad, so that income drops.
a. Small Recession, Peg Credible
In this case there is a small reduction in income, so the cost of pegging is low. The peg is credible.
b. Large Recession, Peg Credible
Here the loss in income is higher, exacerbated by the tight monetary policy required to keep the peg. Assume the peg is still credible. Thus, the output cost increases with the size of the shock, if the peg is credible.
Suppose speculators expect Britain to allow the currency to abandon the peg next year, allowing the pound to depreciate to regain full employment. However, the anticipated depreciation creates a currency premium today. To maintain the peg, even if it is not credible, Britain must raise its interest rates. This will depress demand even more. Furthermore, it must deplete its reserves, increasing the likelihood of a speculative attack. Conclusion: If speculators think the peg is not credible, then interest rates increases, reserves fall, and income falls even more.
c. The Costs and Benefits of Pegging
Begin with a graphical depiction of the costs and benefits of pegging. Benefits are flat. Costs always increase whenever there is an adverse shock. Costs are greater when the peg is not credible than when it is credible, and they increase faster when the peg is not credible. Now consider a game between speculators and the government: The government has two strategies (peg or depreciate); speculators have two beliefs (peg or depreciate). There are several types of equilibria: Zone 1: The costs of pegging are low, so the government always plays “peg.” In anticipation, speculators also play “peg.” So there is a unique, self-confirming equilibrium, to peg. Zone 3: The costs of pegging always exceed the benefits, so the government always plays “depreciate.” Speculators respond by playing “depreciate” as well. There is a unique, self-confirming equilibrium, to depreciate. Zone 2: The costs of pegging for a noncredible peg exceed the benefits of pegging, which in turn exceeds the costs of a credible peg. If speculators play “depreciate,” then the government will play “depreciate” too. But if speculators play “peg,” the government will play “peg.” There are two self-confirming equilibrium in this zone.
In the previous section, we found that inconsistent fiscal policies under a fixed exchange rate regime eventually cause an exchange rate crisis. However, the crises of the 1990s often did not conform to a model based on deficit monetization because budget problems were absent in many cases. In particular, the Exchange Rate Mechanism (ERM) crisis of 1992 affected developed countries in Europe, most of which were unlikely to monetize deficits. In countries with apparently sound economic policies, foreign currency speculators went for the attack and pegs broke.22
Economists therefore developed alternative models of crises, with the pioneering work on the second-generation crisis model being done by Maurice Obstfeld. These types of models can explain how, even when policy making is rational and purposeful—rather than incompetent and inconsistent—there may still be situations in which pegs break for no apparent reason.23
The Basic Problem: Contingent Commitment
The essence of the model is that policy makers are not committed to the peg under all circumstances. Defending the peg is therefore a contingent commitment (a slight oxymoron): if things get “bad enough,” the government will let the exchange rate float rather than put the country through serious economic pain. The problem is that everyone—especially, investors in the forex market—knows this and will adjust their expectations accordingly.
To develop some intuition, we return to Britain and Germany in 1992, the example we saw at the start of the previous chapter when we studied fixed and floating regimes. Let’s recap the basic story: the German central bank raised interest rates to deal with a domestic shock, the fiscal expansion arising from German unification after 1989. This left Britain with a higher interest rate and a lower output level than it wanted. What would Britain do in response?
If German interest rates are fairly low, so too are British interest rates, output costs in Britain are low, and nobody expects Britain to leave the peg. The peg is credible. But if German interest rates rise to high levels, output in Britain falls to an intolerably low level, and nobody expects Britain to stay on the peg for long. Instead, everyone thinks Britain will float and use expansionary monetary policy to boost output and depreciate the pound. The peg is not credible, and the market now expects a depreciation in the future.
The problem for Britain is that an expected depreciation will introduce a currency premium, as we saw earlier in this chapter. Investors will demand even higher interest rates in Britain to compensate for the imminent depreciation—and this will mean even lower output and even higher pain for Britain!
This creates a gray area. How? It is quite possible that the German interest rate can be at some “intermediate” level at which pegging is tolerable with no expected depreciation: people would expect the peg to hold and the peg would hold. But if there is an expected depreciation and a currency premium, pegging might be intolerable: people would expect the peg to fail and the peg would fail. Crucially, in both scenarios, ex ante market expectations are validated ex post, and hence would be considered “rational.”
388
Based on these insights from the Britain-Germany example, we now develop an economic model with such self-fulfilling expectations. In this model we may not always find a single, unique equilibrium but rather multiple equilibria. Whether there is a crisis depends entirely on market sentiment, and not simply economic fundamentals.
A Simple Model
This is a very neat model, but for the students it will not be simple. Develop it in three steps: (1) Make sure they understand the IS-LM arguments that produce the key results about the costs of pegging. (2) Map this into Figure 20-17, an exercise they will find complicated. (3) Explain the game and its zones of equilibria.
In this type of model, we need a measure of the cost of maintaining the peg. The simplest cost measure is the deviation of output Y in the short run below its full employment level. To allow output to vary, we need to use the IS-LM-FX model introduced in the chapter on macroeconomic policy, which means that we reverse some of the assumptions we made before. From now on, output Y will be variable rather than fixed, and it will be determined by the model. And from now on, prices will be sticky, not flexible, and treated as given.24
389
For simplicity, we assume there are some benefits from pegging, say, the gains from increased trade. Let these benefits be b > 0 and constant. Against the benefits of pegging, the government weighs costs c that equal the “output gap”: full-employment  output minus current output Y. If costs exceed benefits, we assume that the government will elect to float next period and use monetary policy to restore full employment output. For simplicity, we assume each period lasts one year. (Restricting attention to this type of rule keep things simple while illustrating the key trade-offs.)
In Figure 20-16, we use the home IS-LM-FX diagram to look at how outcomes under the peg can depend on both economic fundamentals and market expectations. We assume foreign output is fixed at Y*, and we also assume there is no fiscal policy change, so we can focus only on home monetary policy choices. Most important, we assume that investors are aware of the contingent commitment to the peg.
In this setup, it does not matter where adverse output shocks originate. They could result from increases in the foreign interest rate (as in the ERM example). Or they could be caused by a decline in the demand for home goods overseas. All that matters is that the home economy is in some kind of pain with output below the desired level.
390
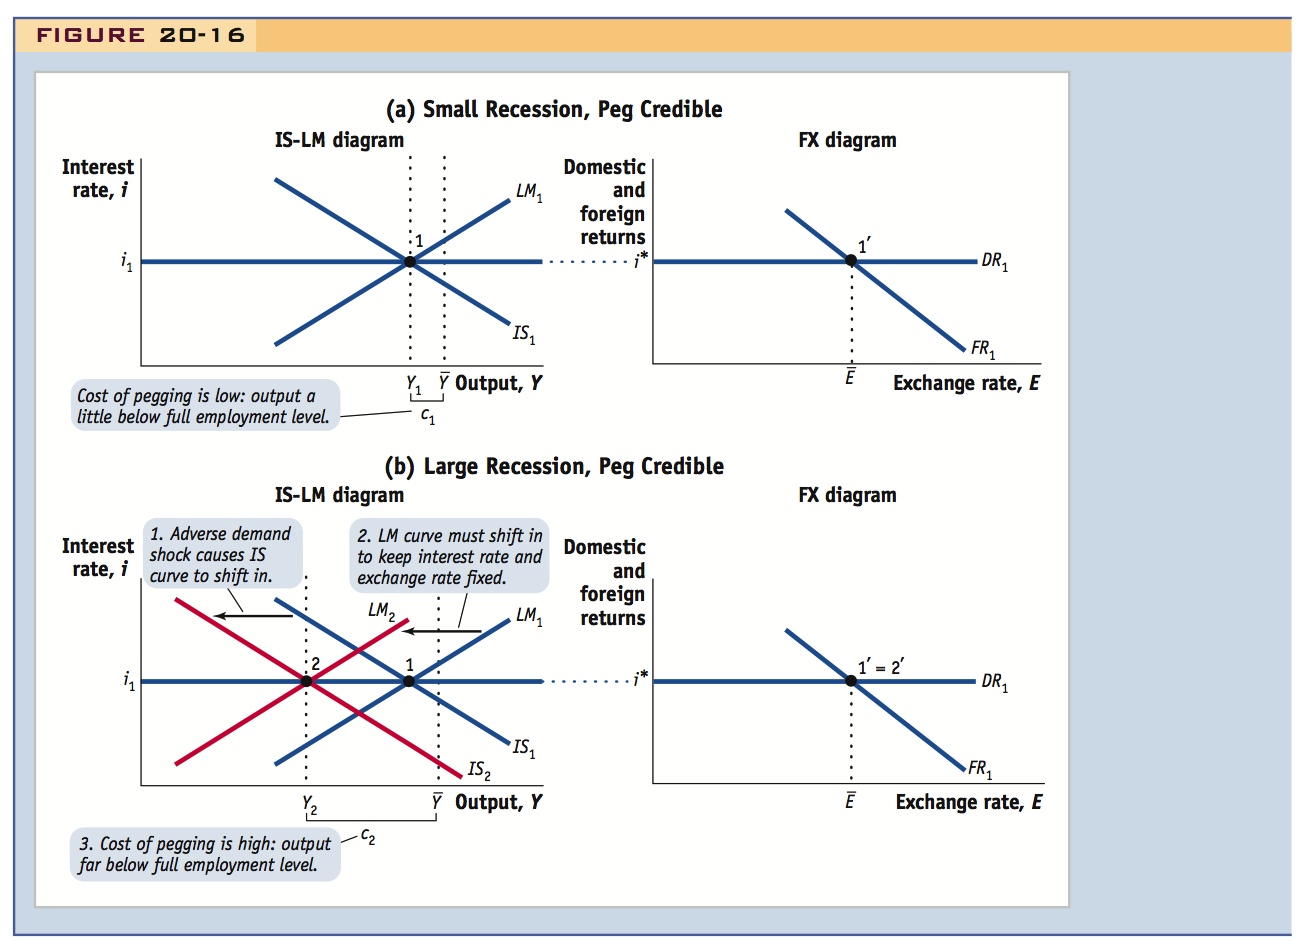
Small Recession, Peg Credible Panel (a) shows a situation in which the pain is small. Initially, the IS1 and LM1 curves intersect at equilibrium point 1, and the home interest rate is i1 = i* to maintain the peg. In the FX diagram, the domestic return is DR1 and the foreign return FR1. They intersect at point 1′ and the exchange rate is fixed at E1 =  . Home output is at Y1, but we assume that the desired full employment level of home output is , slightly higher than Y1. In this situation, when the peg is credible, the economy suffers a small cost given by the “output gap”: c1 = − Y1.
Large Recession, Peg Credible Panel (b) shows a situation in which the adverse shock to output is large. The IS2 and LM2 curves now intersect at equilibrium point 2. The IS curve has moved left by assumption: it is the source of the adverse shock. The LM curve has moved in to maintain the peg and preserve interest parity, so that the home interest rate remains at i1 = i*. In the FX diagram, the domestic return is still DR1 and the foreign return is still FR1, and they intersect at point 2′, the same as point 1′, with E1 = . Home output is now much lower at Y2. Here, the economy suffers an even larger cost given by the “output gap”: c2 = − Y2.
We obtain our first important result: if the market believes that the peg is credible, the output gap (cost) increases as the size of the adverse shock increases.
Large Recession, Peg Not Credible This is the most complex situation. Panel (c) assumes a large recession as in panel (b), but shows what happens if investors believe that the authorities will choose to depreciate next year to achieve desired output. We suppose exchange rate expectations are unchanged next year at the pegged rate. The IS curve will still be at IS2, and the required monetary expansion next year will shift the LM curve to LM4 so that the new equilibrium will be at point 4 with output at the desired level , and a low interest rate of i4. This will lead to a temporary depreciation next year, the peg will break, and the exchange rate will rise from to Efloat. We can also see that to achieve full employment output, the lower that Y2 is, the larger the required shift in the LM curve will be next year and the larger the resulting depreciation.
However, the government’s response next year will be anticipated by investors. If they know that output is low enough to prompt a depreciation, they will expect a depreciation over the coming year of a size given by  . This expected depreciation will appear today as a currency premium in the FX market of panel (c). The current period’s risk-adjusted foreign return curve shifts up to FR2 by an amount equal to the currency premium.
If the central bank wants to maintain the peg, even though it is not credible, it has to ensure forex market equilibrium at point 3′, so it must raise the home interest rate to i3. At today’s pegged rate , uncovered interest parity now requires a higher home interest rate 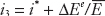 . Graphically, this means the domestic return curve must also shift up (to DR2) by an amount equal to the currency premium.
As we know from the earlier chapters on policy and regimes, this shift will depress home demand and lead to even lower home output today, which is shown at Y3.
In more detail, today the IS curve moves out slightly to IS3 due to expected depreciation, but the LM curve moves in a long way to LM3 to defend the peg. The latter effect dominates, because we know that demand and output have to be lower today given the combination of the same exchange rate (no change in the trade balance) and a higher interest rate (lower investment demand). So the new IS-LM equilibrium is at point 3, to the left of point 2.
391
We also note that to achieve this monetary contraction, the central bank must sell reserves—and the drain can take the form of a speculative attack if the currency premium appears suddenly as a result of a switch in beliefs.
The loss of credibility makes a bad recession even worse. If the peg is not credible, a higher interest rate causes the costs of pegging to rise to c3 = − Y3. Finally, we note that this cost will be higher when the output gap is higher, because a larger output gap implies a larger depreciation to restore full employment.
Our second important result: if the forex market switches to believing that the peg is not credible, then reserves drain, the interest rate rises, and the output gap (cost) increases; also, the cost increases more if the output gap is larger to begin with.
The Costs and Benefits of Pegging Our IS-LM-FX analysis is now complete, and all we need to do is consider the implications.
Figure 20-17 sums up the cost–benefit analysis. The horizontal axis measures the output gap, or the cost of pegging, when the peg is credible. We denote these costs c(). This notation indicates that this is the cost c when the exchange rate is expected to be at next period. The first of our results showed that this cost rises, and we move right along the horizontal axis, whenever the country suffers an adverse shock under the peg.
392
The vertical axis measures and compares the costs and benefits of pegging. Benefits are constant at b. The costs when the peg is credible are equal to c() so these will fall on the 45-degree line, since c() is measured on the horizontal axis.
Finally, the cost of pegging when the peg is not credible is denoted c(Efloat). This notation indicates that this is the cost c when the exchange rate is expected to be at Efloat next period.
The second of our results showed that the costs of pegging when the peg is not credible are always greater than the costs when the peg is credible, due to the rise in the currency premium associated with an expected depreciation. In other words, the c(Efloat) line is above the c() line, as shown. We also saw that the difference gets larger as the costs grow larger. In Figure 20-17, this means that the c(Efloat) curve diverges from the c() curve, as shown.
Corresponding to the previous analysis in Figure 20-16, point 1 (cost c1) represents a small recession with a credible peg; point 2 (cost c2) represents a large recession with a credible peg; point 3 (cost c3) represents the same large recession with a noncredible peg.
Since we are calling this a "game," it is tempting--since the students by now have some experience with such 2x2 games--to actually model it as one. This would require specifying the objective and payoffs of investors, in addition to their strategies, however, and the model is already complicated enough.
With this basic apparatus, we can now analyze the “game” between the authorities and investors. To keep it simple, we suppose investors can choose from two beliefs about what the government will do: {peg, depreciate}. And we suppose the authorities then choose from two actions: {peg, depreciate}. Faced with this type of problem, economists search for what might be considered a rational outcome of the game. We look for a self-confirming equilibrium, that is, combinations of investor beliefs and government actions for which the ex post outcome validates the ex ante beliefs.
We can identify several such equilibria using Figure 20-17:
- In Zone I, b > c(Efloat) > c(), so the benefits b of pegging always outweigh both kinds of costs, no matter what the market believes. The authorities will always choose to “peg.” Anticipating this, the market belief will also be peg, and this is the only ex ante belief that will be validated ex post. Benefits are always given by b, and costs are always those of a credible peg c(). There is a unique self-confirming equilibrium: peg, with costs corresponding to the solid portion of the line c(). (Example: point 1.)
- In Zone III, c(Efloat) > c() > b, so both kinds of costs of pegging always outweigh the benefits b, no matter what the market believes. The authorities will always choose to “depreciate.” Anticipating this, the market belief will also be depreciate, and this is the only ex ante belief that will be validated ex post. Benefits are then always given by b, and the costs are always those of a noncredible peg c(Efloat). There is a unique self-confirming equilibrium: depreciate, with costs corresponding to the solid portion of the line c(Efloat). (Example: point 5.)
- In Zone II, c(Efloat) > b > c(). If the market belief is “depreciate,” then the benefits b of pegging are less than the costs of the noncredible peg c(Efloat); authorities will then choose depreciate, and market beliefs are validated for this case. Conversely, if the market belief is peg, then the benefits b of pegging are greater than the costs of a credible peg c(); authorities will then choose peg, and the market beliefs are also validated for this case. There are two self-confirming equilibria in this zone. Zone II is shown as a gray area in the diagram. And appropriately so! In this range, there is no unique equilibrium, and depending on market beliefs, costs may correspond to the solid portions of either line c() or line c(Efloat). (Examples: points 2 and 3.)
393
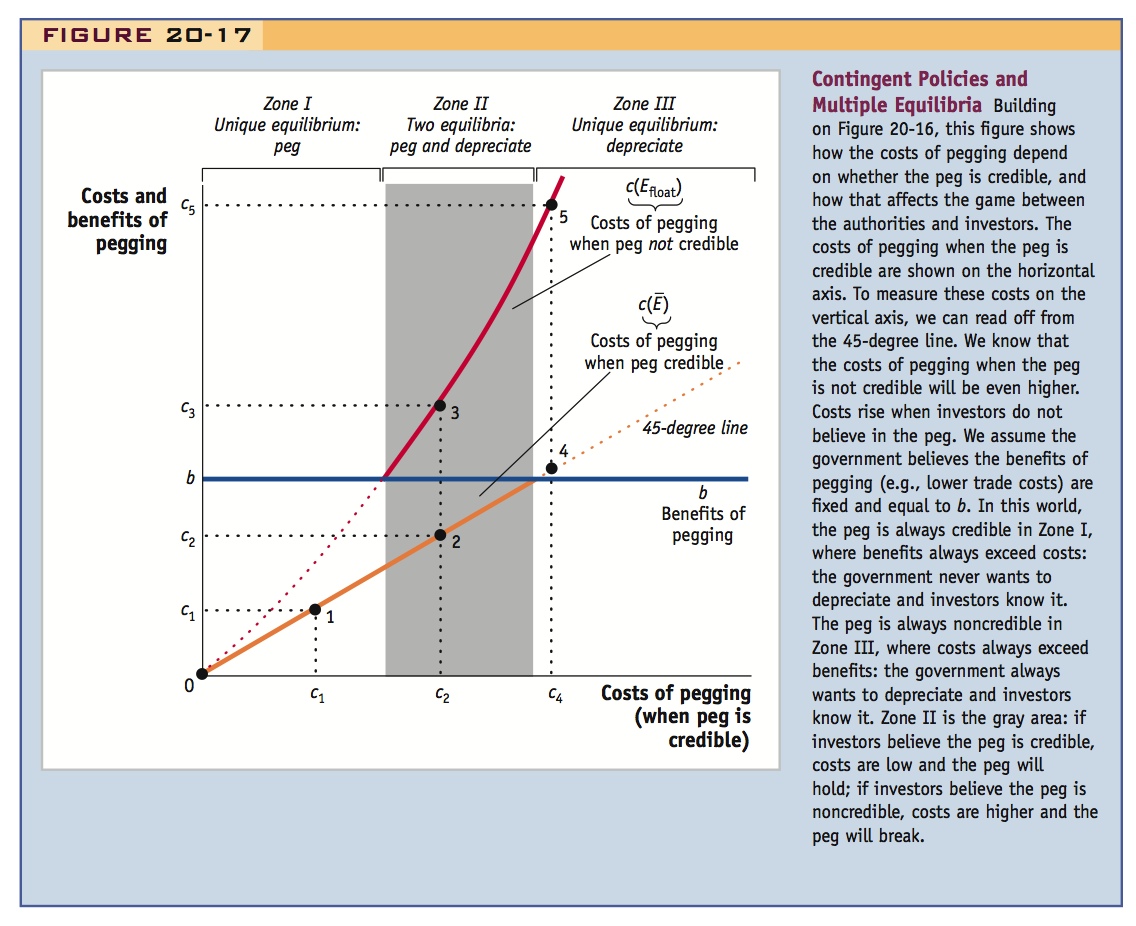
This argument highlights the importance of changes in investor sentiments, or “animal spirits,” in speculation. But this instability may be exacerbated by two things: (1) If depreciation is expected in the very near future, the currency premium can get very big, heightening the chances of an attack. (2) What if one very large speculator changes his opinions? This might change the opinions of the whole market. A classic example is of George Soros betting against the pound in 1992.
Students will find the notion of multiple equilibria interesting but confusing, and will pose exactly this question. The example of Soros is a neat case study.
The Man Who Broke the Bank of England
Our analysis of contingent policies is highly simplified but advances our understanding of the potential for capricious outcomes driven by shifts in market sentiment. Changes in market sentiment, often called “animal spirits,” emerge here from a model based on rational actors.
In some circumstances, the instability problem is much worse than we have suggested, for a couple of reasons. First, we have assumed that the government does not exit the peg immediately when it suffers pain, so expectations of depreciation are slow. If a 10% devaluation is feared in one year, this causes a 10% currency premium. But if it is expected to happen in three months (next quarter), then the expected rate of depreciation on an annualized basis is much higher and is given by a fourfold compounding of a 10% increase: this is 46% (because 1.10 to the power 4 equals 1.46). So the currency premium would be approximately 46%, a heavy penalty. If the 10% devaluation were expected in one month, the premium would be more than 200% on an annualized basis.25 As the time frame shrinks, the currency premium explodes!
For example, in 1992 Swedish interest rates climbed astronomically as investors speculated on the imminent demise of the krona’s peg to the German mark. The annualized short-term (overnight) lending rate climbed to 75% on September 8 and 500% on September 19. Such an interest rate was not politically tenable for very long. Investors knew this, and they were proved right.
A second issue is how beliefs form in the first place. Suppose we are in Zone II at the “no crisis” self-confirming equilibrium, with beliefs and actions corresponding to “peg.” A mass switch in beliefs to “depreciate” would also be a self-confirming equilibrium. How does the market end up in one equilibrium or the other?
If traders are a group of many individuals, spread diffusely throughout the market, then it is unclear how they could all suddenly coordinate a switch to a new set of beliefs. And if each trader can place only a small bet, then it would be irrational for any trader to switch beliefs—unless all traders switch, and without coordination the switch is not going to happen and the peg stands a chance of holding.
But what if there are only a few traders? Or even just one very large trader who can make very big bets? If that single trader changes beliefs, the entire market goes from believing “peg” (no bets) to believing “depreciate” (making as big a bet against the home currency as possible). The coordination problem is solved. This is illustrated by the British ERM crisis of 1992. The large trader was the Quantum Fund, owned by the famous (to some, infamous) investor George Soros, who likes to use the term “reflexivity” to describe how markets shape events, as well as vice versa.
394
Soros’s firm placed one big bet after another, until he had borrowed billions of pounds and parked all the money in German mark deposits. “It was an obvious bet, a one-way bet,” he later recalled.26 If the pound held, he could convert his marks back to pounds, having paid a small interest cost (the difference between pound and mark interest rates for a few days); if the peg broke, he made billions as the pound fell. And who sold him the marks in exchange for pounds? The Bank of England, under orders from the U.K. Treasury, was intervening furiously, selling marks to prop up the pound at the limits of the ERM band.
The sudden increase in the currency premium was inducing a massive reserve drain. On the morning of September 16, 1992, the pressure on the pound became intense. The government made a feeble defense, raising the Bank’s interest rates too little, too late, from 10% to 12% and, at the last gasp, to 15%. Pessimistic investors were unimpressed. With bearish sentiment so strong, reserve outflow was unlikely to halt without stronger measures, such as the Swedes had taken the week before. But with the British economy performing weakly, the government had little stomach for triple-digit interest rates—something investors well knew.
It was all over by lunchtime, with the bulk of the reserves lost, and an estimated £4 billion spent in a futile defense. The event has gone down in history as one more legendary British exchange rate fiasco.
Krugman somewhere writes dismissively of critics who imagine that speculators are nefarious "Sori."
Discussion: Did Soros really make the crisis happen, or was it misguided policy by the Treasury from which he shrewdly profited?
Summary
3. Summary
Contingent government policies depend upon market sentiment; conversely, market sentiment depends upon expectations of policy. If costs of pegging are very low, then the fixed rate will be maintained; if costs are very high, then it will never be maintained; but if the costs are neither too low nor too high relative to the benefits of the peg, then there are multiple equilibria. Shifts in investor sentiment can create a crisis.
Our results are striking. If government policies are contingent, then they will depend on market sentiment. But market sentiment, in turn, depends on what the market believes the government will do. If costs of pegging are “low,” then pegs hold when they “should”—when the government has no desire to exit. If costs of pegging are “high,” then crises happen when they “should”—when the government clearly wants to exit. But in between these extremes, an ambiguity arises in the form of multiple equilibria because for some “medium” range of costs, a crisis occurs if and only if the market expects a crisis.