5 Import Quotas
Examples of quotas: the Multifibre Agreement, European quotas on bananas, U.S. on sugar
1. Import Quota in a Small Country
a. Free-Trade Equilibrium
Same as before.
b. Effect of the Quota
Effectively creates a perfectly inelastic export supply. Domestic price increases and imports fall, exactly as with a tariff.
c. Effect on Welfare
Effects on consumer and producer surplus are the same as with a tariff, but the government gets no tariff revenue. The quota rent goes to whomever has the right to import the good. Four possibilities:
d. 1. Giving the Quotas to Home Firms: Give quota licenses to Home firms, so deadweight loss is the same as with a tariff.
e. 2. Rent Seeking: If Home firms engage in rent-seeking activities to acquire the licenses, then all or part of the quota rent could be a loss.
f. 3. Auctioning the Quota: Auction the licenses to recover revenue to the government from the quota rent. Deadweight loss could in principle be the same as with a tariff.
g. 4. “Voluntary” Export Restraint: Foreign government implements the quota, usually allocating it to Foreign producers: A “Voluntary” Export Restriction. Here the quota rents go to the Foreign producers, which is a welfare loss to Home.
h. Costs of Import Quotas in the United States
Most quota rents went to Foreign producers. In mid-1980s deadweight losses from quotas were from $8 billion to $12 billion a year; the quota rents going to foreigners were an additional $7 billion to $17 billion.
On January 1, 2005, China was poised to become the world’s largest exporter of textiles and apparel. On that date, a system of worldwide import quotas known as the Multifibre Arrangement (MFA) was abolished. Import quotas are a restriction on the amount of a particular good that one country can purchase from another country. Under the Multifibre Arrangement, begun in 1974, import quotas restricted the amount of nearly every textile and apparel product that was imported to Canada, the European countries, and the United States. These countries limited their textile imports to protect their own domestic firms producing those products. With the end of the MFA, China was ready to enjoy greatly increased exports—but this did not occur. The threat of import competition from China led the United States and Europe to negotiate new temporary import quotas with China, as we discuss in this section.
Besides the MFA, there are many other examples of import quotas. For example, since 1993 Europe had a quota on the imports of bananas that allowed for a greater number of bananas to enter from its former colonies in Africa than from Latin America. In 2005 that quota was simplified and converted into a tariff, even though that tariff still discriminated among countries based on their colonial past. Then, in 2009, Europe agreed to reduce the tariff on Latin American bananas, effectively bringing to an end this “banana war,” which had lasted for more than 15 years (see Headlines: Banana Wars). Another example is the quota on U.S. imports of sugar, which is still in place despite calls for its removal (see Headlines: Sugar Could Sweeten U.S. Australia Trans-Pacific Trade Talks). In this section, we explain how quotas affect the importing and exporting countries and examine the differences between quotas and tariffs. Like a tariff, an import quota often imposes a welfare cost on the importing country. But we will find that quotas can often lead to higher welfare losses for the importer than tariffs do.
Import Quota in a Small Country
Applying an import quota for a small country is similar to applying a tariff, so we can use the graphs developed earlier in the chapter to analyze quotas, too.
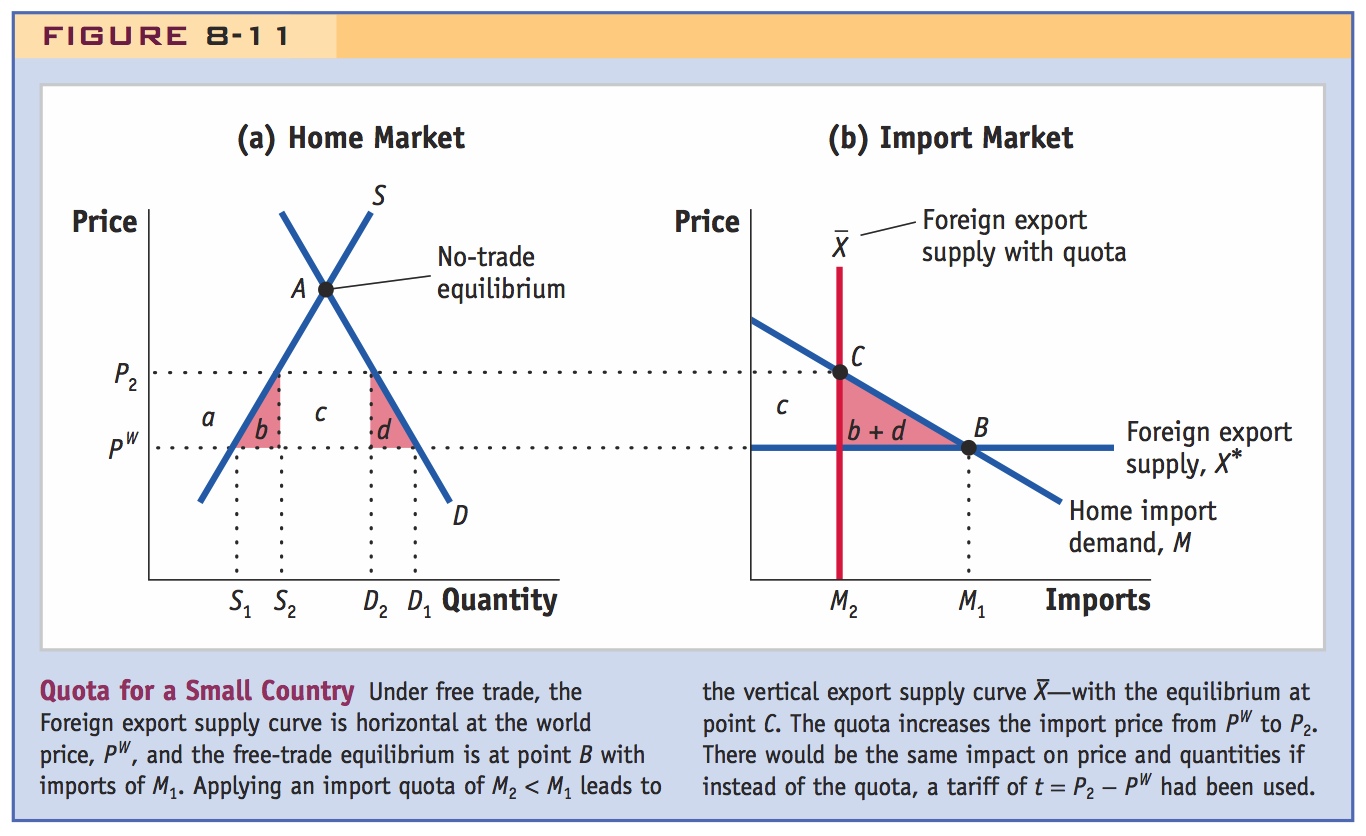
Free-Trade Equilibrium In panel (a) of Figure 8-11, we show the Home demand curve D and the Home supply curve S. At the free-trade world price of PW, Home quantity demanded is D1 and quantity supplied is S1, so imports are M1 = D1 − S1. The import demand curve M = D − S is shown in panel (b). The assumption that the Home country is small means that the fixed world price PW is not affected by the import quota, so under free trade, the Foreign export supply curve X* is a horizontal line at the world price PW. The Home import demand curve M and Foreign export supply curve X* intersect at point B, resulting in the free-trade level of imports, M1.
264
Effect of the Quota Now suppose that an import quota of M2 < M1 is imposed, meaning that the quantity imported cannot exceed this amount. This quota effectively establishes a vertical export supply curve labeled as  in panel (b), which fixes the import quantity at M2. The vertical export supply curve now intersects import demand at point C, which establishes the Home price of P2. In panel (a), the price of P2 leads firms to increase the quantity supplied to S2 and consumers to decrease their quantity demanded to D2.
The import quota therefore leads to an increase in the Home price and a reduction in Home imports, just like a tariff. Furthermore, notice that there would be an equivalent effect on the import price and quantity if instead of the quota, the government had imposed an import tariff of t = P2 − PW. That is, the tariff of t = P2 − PW would raise the Home price to P2 and reduce imports to the level M2. We conclude that for every level of the import quota, there is an equivalent import tariff that would lead to the same Home price and quantity of imports.14
Effect on Welfare As we have shown, the quota leads to an increase in the Home price. The rise in the price for consumers leads to a fall in consumer surplus. That fall is measured by the area between the prices P2 and PW and to the left of the demand curve, which is the area (a + b + c + d) in panel (a) of Figure 8-11. On the other hand, the increase in the price facing Home producers leads to a gain in producer surplus. That gain is measured by the area between the prices P2 and PW and to the left of the supply curve, which is the area a in Figure 8-11(a). These two welfare effects are the same as would occur under a tariff.
265
Article on European quotas on bananas from Latin America
Banana Wars
This article discusses a well-known example of a quota that applied to European imports of bananas. The quota and discriminatory tariff on bananas from Latin America finally ended in late 2009.
I can hardly believe the banana wars are over. The dispute started back in 1993 when the European Union set quotas favoring banana imports from Ivory Coast, the Windward Islands and other former colonies at the expense of imports from Latin America. American banana companies and the Latin American countries where they grow their bananas sued the E.U., accusing it of rigging an unfair trade deal, first under the GATT and then under the W.T.O.
The suit dragged on for years, and at several points threatened to spark an all-out trade war between Washington and Europe. In 1999, after a meeting on Kosovo was hijacked by the banana crisis, the secretary of state then, Madeleine Albright, declared in exasperation: “I never in my life thought I would spend so much time on bananas.”
It finally ended this month when the E.U. said it would continue to grant tariff-free access to its former colonies but would reduce tariffs on Latin American bananas by 35 percent over seven years. The United States and Latin American producers agreed to drop their case. After all the roiling, what strikes me now is how little people seem to care. That says a lot about how attitudes toward trade have changed.
When this started, trade was trumpeted as the single most important tool for development. Europe insisted that its special treatment of its former colonies was central to its post-imperial responsibilities. The United States and Latin American countries vowed to hold the line for free trade—over bananas at least—to make it a tool of development for all.
Today nobody talks about bananas. Stalled global trade talks (remember Doha?) barely get mentioned. There are a lot of problems out there, including the collapse of world trade in the wake of the global recession and the looming threat of protectionism. Yet there has also been a rethinking about trade’s supposed silver bullet role in economic development.
China’s growth stands as a beacon for the power of trade. But others that have hitched their economic strategy to trade, like Mexico, have found prosperity elusive. Despite growing banana exports, both the Latin American banana exporters and Europe’s impoverished former colonies remain poor.
One thing we have learned over the past 15 years is that trade is necessary but not sufficient for development. Countries also need investment in infrastructure, technology and human capital. They need credit. They need legitimate institutions—like clean courts to battle monopolies—and help building them. Putting up a few barriers against banana imports, or tearing a few of them down, can’t do it all.
Source: Eduardo Porter, The New York Times, December 29, 2009, p. A30. © 2009 The New York Times. All rights reserved. Used by permission and protected by the Copyright Laws of the United States. The printing, copying, redistribution, or retransmission of this Content without express written permission is prohibited.
The quota and tariff differ, however, in terms of area c, which would be collected as government revenue under a tariff. Under the quota, this area equals the difference between the domestic price P2 and the world price PW, times the quantity of imports M2. Therefore, whoever is actually importing the good will be able to earn the difference between the world price PW and the higher Home price P2 by selling the imports in the Home market. We call the difference between these two prices the rent associated with the quota, and hence the area c represents the total quota rents. There are four possible ways that these quota rents can be allocated:
1. Giving the Quota to Home Firms First, quota licenses (i.e., permits to import the quantity allowed under the quota system) can be given to Home firms, which are then able to import at the world price PW and sell locally at P2, earning the difference between these as rents. An example of this is the dairy industry in the United States, in which U.S. producers of cheese receive licenses to import from abroad. With home firms earning the rents c, the net effect of the quota on Home welfare is
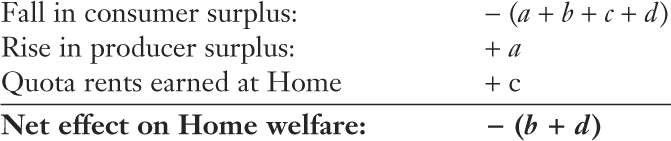
We see from this calculation that the net effect on Home welfare is a loss of amount (b + d). That loss is the same as what we found in Section 3 of this chapter for the loss of a tariff in a small country. As in that section, we still refer to (b + d) as a deadweight loss.
266
The sugar quota has a fascinating history. In a book from 1996--excerpts from which would make a good reading assignment--Anne Kreuger showed how it was originally intended by Roosevelt to support the Cuban economy, but later became captive to domestic industry lobbyists.
Sugar Could Sweeten U.S. Australia Trans-Pacific Trade Talks
This article discusses the reasons for a sugar quota in the United States, which has been in place since before World War II. Under current negotiations for the Trans-Pacific Partnership, Australia has asked the United States to reconsider this quota and allow more exports from Australia.
Australia’s sugar growers and investors could end up with a sweeter deal under the upcoming Trans-Pacific Partnership negotiations as the U.S. faces growing calls to put its long-standing sugar import restrictions on the table. The U.S. has been leading the wide-ranging regional talks, which aim to eliminate barriers to trade between the world’s largest economy and some of the fastest-growing markets. In all, the 11 countries in the talks—which include Australia—account for one-third of U.S. trade…. [The] U.S. may finally be forced to reconsider the limits on sugar imports it has had in place since before the start of the Second World War.
To be sure, sugar is a sticky subject in the U.S. That’s not only because it’s already the world’s largest importer of sugar, buying from more than 40 countries, the largest market for sweeteners or because, with annual production in excess of 8 million short tons, it’s also one of the world’s largest producers. It’s because the sugar industry—which employs around 142,000 people and generates nearly $20 billion a year, according to lobby group the American Sugar Alliance—is extremely politically vocal and represents important votes in key swing states. For this reason the industry has been able to keep trade barriers intact that, for decades, kept domestic prices at roughly double the world price until about 5 years ago.
…[A]s the world’s third-largest sugar exporter, Australia stands to reap significant benefits if the U.S. relaxes its regulations. Tom Earley, vice president for Agralytica Consulting, estimates there’s an annual shortfall of more than 1 million metric tons in the U.S. that isn’t met by fixed quotas and so would be up for grabs under any changes. “Australian negotiators are saying everything should be on the table and that makes sense to me,” he said. “At the end of the day everything is on the table.”…A spokesman for Australia’s Department of Agriculture, Fisheries and Forestry said the U.S. remains a “valued market for the Australian sugar industry, despite volumes being constrained.” The government “continues to press for increased sugar access to the U.S., although this remains a difficult issue for both countries,” he added.
Source: Excerpted from Caroline Henshaw, The Wall Street Journal, October 18, 2012. Reprinted with permission of The Wall Street Journal, Copyright © 2012 Dow Jones & Company, Inc. All Rights Reserved Worldwide.
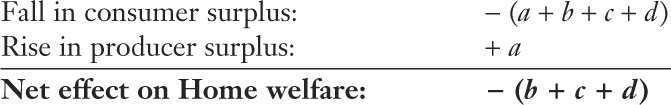
2. Rent Seeking One complication of simply giving valuable quota licenses to Home firms is that these firms may engage in some kind of inefficient activities to obtain them. For example, suppose that Home firms are producing batteries and import the chemical needed as an input. If licenses for the imported chemicals are allocated in proportion to each firm’s production of batteries in the previous years, then the Home firms will likely produce more batteries than they can sell (and at lower quality) just to obtain the import licenses for the following year. Alternatively, firms might engage in bribery or other lobbying activities to obtain the licenses. These kinds of inefficient activities done to obtain quota licenses are called rent seeking. It has been suggested that the waste of resources devoted to rent-seeking activities could be as large as the value of rents themselves so that the area c would be wasted rather than accrue to Home firms. If rent seeking occurs, the welfare loss due to the quota would be
267

The waste of resources due to rent seeking leads to a fall in Home welfare of (b + c + d), which is larger than that for a tariff. It is often thought that rent seeking is more severe in some developing countries where rules are not well enforced and officials are willing to take bribes in exchange for the licenses.
3. Auctioning the Quota A third possibility for allocating the rents that come from the quota is for the government of the importing country to auction off the quota licenses. This occurred in Australia and New Zealand during the 1980s. In Australia, the auctions covered imports of textiles, apparel, footwear, and motor vehicles. The quota auctions used for imports of textiles and apparel in Australia were an alternative to the Multifibre Arrangement (MFA). Auctions of import quotas have also been proposed in the United States but have never actually occurred.15 In a well-organized, competitive auction, the revenue collected should exactly equal the value of the rents, so that area c would be earned by the Home government. Using the auction method to allocate quota rents, the net loss in domestic welfare due to the quota becomes
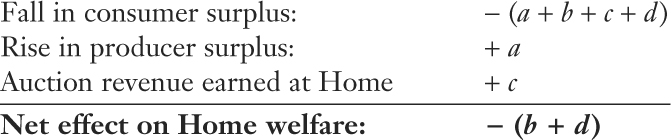
The net effect on Home welfare in this case is the deadweight loss of (b + d), which is once again the same loss as incurred from a tariff.
4. “Voluntary” Export Restraint The final possibility for allocating quota rents is for the government of the importing country to give authority for implementing the quota to the government of the exporting country. Because the exporting country allocates the quota among its own producers, this is sometimes called a “voluntary” export restraint (VER), or a “voluntary” restraint agreement (VRA). In the 1980s the United States used this type of arrangement to restrict Japanese automobile imports. In that case, Japan’s Ministry of International Trade and Industry (MITI), a government agency that implements Japan’s trade policies, told each Japanese auto manufacturer how much it could export to the United States. In this case, the quota rents are earned by foreign producers, so the loss in Home welfare equals
268
The Japanese VERs were initially adopted in response to U.S. pressure while the dollar was appreciating in the early 1980s. But when it expired in the early 1990s, the Japanese eagerly offered to renew them.
The VER gives a higher net loss (b + c + d) for the importer than does a tariff because the quota rents are earned by foreign exporters. This result raises the question of why VERs are used at all. One answer is that by giving the quota rents to firms in the exporting country that country is much less likely to retaliate by adopting import tariffs or quotas of its own. In other words, the transfer of quota rents to the exporter becomes a way to avoid a tariff or quota war.
Costs of Import Quotas in the United States Table 8-3 presents some estimates of the home deadweight losses, along with the quota rents, for major U.S. quotas in the years around 1985. In all cases except dairy, the rents were earned by foreign exporters. We discuss the case of automobiles in the next chapter, for which the quota rents earned by foreigners range from $2 billion to $8 billion. Textiles and apparel also had very large quota rents and U.S. deadweight losses (about $5 billion each) under the MFA. In addition, the MFA imposed large losses on the Foreign exporting countries, due to rent-seeking activities by exporters to obtain the quota permits. Adding up the costs shown in Table 8-3, the total U.S. deadweight loss from these quotas was in the range of $8 billion to $12 billion annually in the mid-1980s, whereas the quota rents transferred to foreigners were another $7 billion to $17 billion annually.
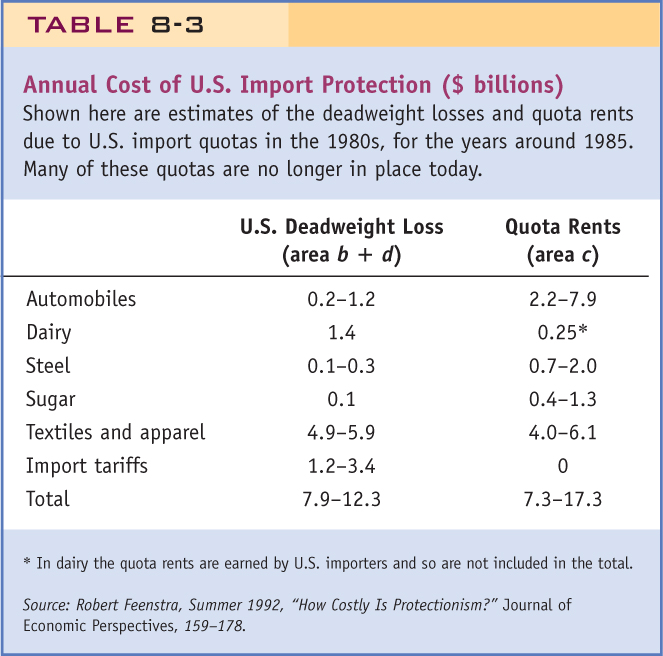
Some, but not all, of these costs for the United States are no longer relevant today. The quota in automobiles ceased being applied after 1987 because Japanese producers built plants in the United States and therefore reduced their imports. The quotas in the steel industry were replaced by the “safeguard” tariffs that President Bush temporarily imposed from 2002 to 2003. But the quotas used in sugar remain, and while the MFA expired on January 1, 2005, it has been replaced by a new set of quotas with China. There is the prospect of continuing losses for the United States due to quotas in these industries, as we discuss in the next application to textiles and apparel.
269
Sanctioned by GATT, MFA allowed quotas on textile and apparel from developing economies. It ended in 2005. China then enjoyed an increase in exports of textile and apparel, so prices fell in developed economies. Welfare cost of MFA to U.S. was around $11.4 billion per year when it ended. U.S. and Europe threaten new quotas; China agrees to VERs, but rejects quotas in 2009.
China and the Multifibre Arrangement
One of the founding principles of GATT was that countries should not use quotas to restrict imports (see Article XI of Side Bar: Key Provisions of the GATT). The Multifibre Arrangement (MFA), organized under the auspices of the GATT in 1974, was a major exception to that principle and allowed the industrial countries to restrict imports of textile and apparel products from the developing countries. Importing countries could join the MFA and arrange quotas bilaterally (i.e., after negotiating with exporters) or unilaterally (on their own). In practice, the import quotas established under the MFA were very detailed and specified the amount of each textile and apparel product that each developing country could sell to countries including Canada, Europe, and the United States.
Although the amount of the quotas was occasionally revised upward, it did not keep up with the increasing ability of new supplying countries to sell. Under the Uruguay Round of WTO negotiations held from 1986 to 1994, developing countries were able to negotiate an end to this system of import quotas. The MFA expired on January 1, 2005. The biggest potential supplier of textile and apparel products was China, so the expiration of the MFA meant that China could export as much as it wanted to other countries—or so it thought. The potential for a huge increase in exports from China posed a problem for many other countries. Some developing countries expected that rising exports from China would compete with their own export of apparel items, on which many workers depended for their livelihood. The large producers in importing countries were also concerned with the potential rise in Chinese exports because it could lead to the loss of jobs for their own workers in textiles and apparel.
Growth in Exports from China Immediately after January 1, 2005, exports of textiles and apparel from China grew rapidly. For example, exports of Chinese tights and pantyhose to the European Union increased by 2,000% in January and February, as compared with a year earlier; imports of pullovers and jerseys from China jumped nearly 1,000%; and imports of trousers more than tripled. Overall in 2005, China’s textile and apparel imports to the United States rose by more than 40% as compared with the year before, as shown in Figure 8-12, where we include the top 20 exporters to the U.S. market.16 In panel (a), we show the change in the value of textile and apparel imports from each country. The surge of imports from China came at the expense of some higher-cost exporters, such as South Korea, Hong Kong, and Taiwan, whose exports to the United States declined by 10% to 20%.
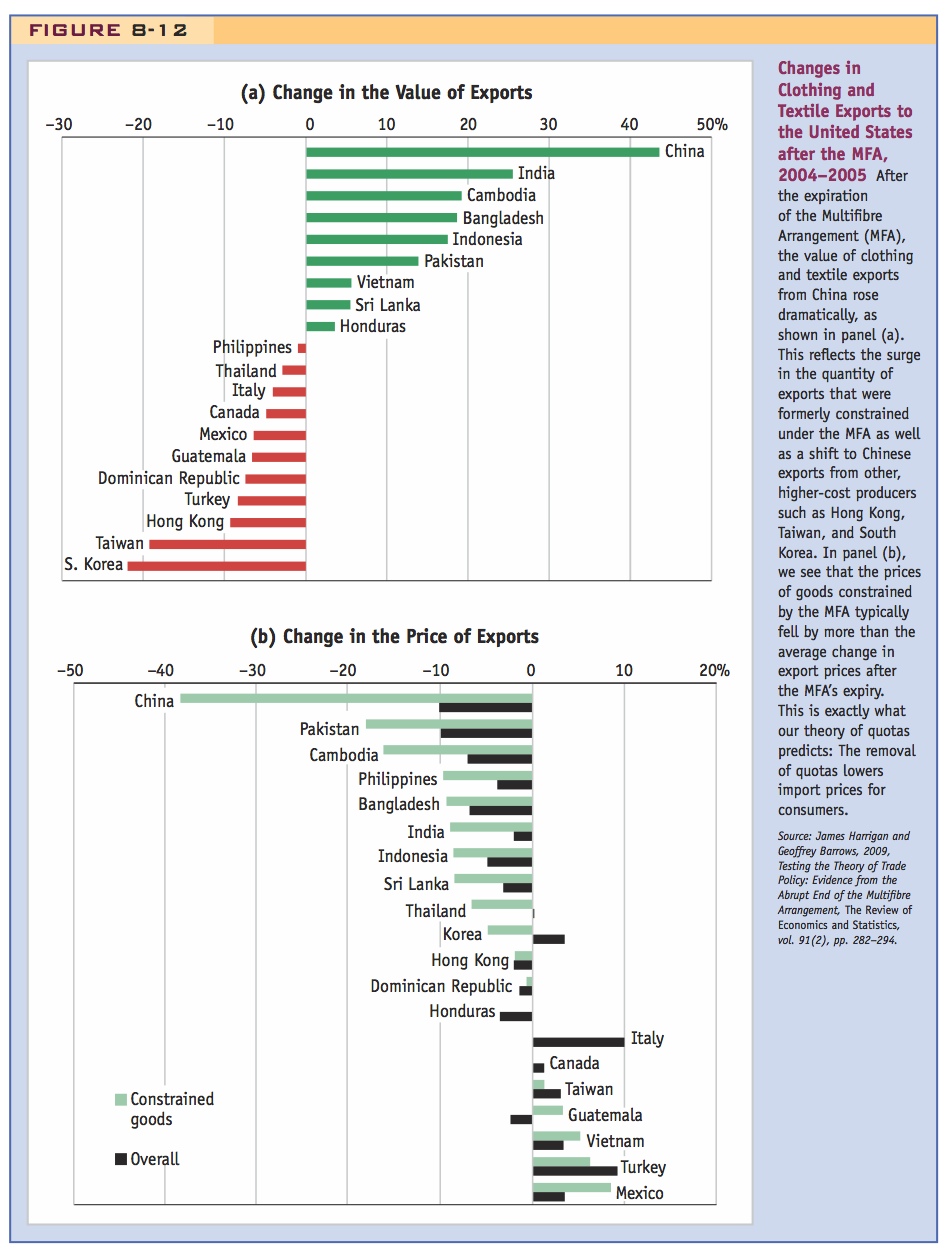
In panel (b) of Figure 8-12, we show the percentage change in the prices of textiles and apparel products from each country, depending on whether the products were “constrained goods,” subject to the MFA quota before January 1, 2005. China has the largest drop in prices from 2004 to 2005, 38% in the “constrained goods” categories. Many other countries also experienced a substantial fall in their prices due to the end of the MFA quota: 18% for Pakistan; 16% for Cambodia; and 8% to 9% for the Philippines, Bangladesh, India, Indonesia, and Sri Lanka. A drop in price due to the removal of the import quota is exactly what we predict from the theory, as we move from the price P2 in Figure 8-11 to the free-trade price PW. Surprisingly, a few countries in Figure 8-12 show increases in their prices, such as Mexico. However, less than 1% of Mexico’s sales of textiles and apparel to the United States were constrained by the quota, so that price increase does not appear to be due to the removal of the MFA.
270
271
Welfare Cost of MFA Given the drop in prices in 2005 from countries selling to the United States, it is possible to estimate the welfare loss due to the MFA. The United States did not auction the quota licenses for textiles and apparel so the quota rents were earned by foreign exporting firms. That means the welfare loss for the United States due to the MFA is the area (b + c + d) in Figure 8-11. Using the price drops from 2004 to 2005, that area is estimated to be in the range of $6.5 billion to $16.2 billion in 2005.17 The simple average of these estimates is $11.4 billion as the total cost to the United States. To put that welfare loss in perspective, there were 111 million households in the United States in 2005, and the typical household spent about $1,400 on apparel. Dividing the loss of $11.4 billion by the 111 million households, we obtain about $100 per household, or 7% of their annual spending on apparel as the welfare cost of the MFA.18
Import Quality Besides the overall decline in prices, there was also an interesting pattern to the price drops: the prices of textile and apparel products dropped the most (in percentage terms) for the lower-priced items. So, an inexpensive T-shirt coming from China and priced at $1 had a price drop of more than 38% (more than 38¢), whereas a more expensive item priced at $10 experienced a price drop of less than 38% (less than $3.80). As a result, U.S. demand shifted toward the lower-priced items imported from China: there was “quality downgrading” in the exports from China.
To understand why this quality downgrading occurred, it is easiest to think about the problem in reverse: when a quota like the MFA is applied, what is the effect on quality? The MFA, like most other quotas, was applied to the quantity of the import sent to each country: it was applied to yards of cloth, or number of shirts, or dozens of pairs of socks, and so on. Faced with a quota of that type, the exporting firm would have an incentive to upgrade the type of cloth, shirts, or socks that it sells, since selling a higher value for the same quantity will still meet the quota limitation. So when the MFA starts, we expect to see “quality upgrading” in the exports for each country. By the same logic, when the MFA was removed, there was “quality downgrading” in the exports from China to the United States and exports from other countries, too.
Reaction of the United States and Europe The surge in exports from China to the United States and Europe was short-lived, however. The European Union threatened to impose new quotas on Chinese exports, and in response, China agreed on June 11, 2005, to “voluntary” export restraints that would limit its growth of textile exports to about 10% per year through the end of 2008. For the United States, the ability to negotiate a new system of quotas with China had been guaranteed by a special agreement with China when it joined the WTO in 2001. Under this agreement, China was limited to a 7.5% annual growth in its textile exports to the United States, from 2005 to 2008. This temporary quota expired at the end of 2008, at which time we might have expected the U.S. textile and apparel industry to renew its call for quota protection once again. But because of the worldwide recession, Chinese exports in this industry were much lower in 2009 than they had been in earlier years. For that reason, China indicated that it would not accept any further limitation on its ability to export textile and apparel products to the United States and to Europe, and both these quotas expired.
272