4 External Wealth
Like a family, a country’s net worth is equal to its assets (A) minus its liabilities (L). consists of assets issued by the ROW that it owns; consists of assets issued Home and owned by the ROW. The U.S. is the biggest debtor in history. Why?
1. The Level of External Wealth
The Home country’s net worth, or external wealth is W = A - L. If W > 0 it is a creditor; if W = 0 it is a debtor. Note the country also has internal wealth, the value of all of its nonfinancial assets.
2. Changes in External WealthW will change for two reasons: (1) Financial flows. Net exports of financial assets (the FA) reduces W (2) Valuation Effects. The value of A or L may change because of capital gains or losses (due to price effects or exchange rate changes). Therefore ΔW = (-)FA + capital gains on external wealth. But -FA = CA + FA so ΔW = CA + KA + capital gains.Conclusion: There are three ways to raise external wealth: (1) be thrifty, so > 0, (2) receive charity from others, so KA > 0 or (3) hope for a windfall (positive capital gains).
3. Understanding the Data on External Wealth
Data for the U.S. in 2012. There was a large CA deficit that tended to reduce wealth. However, these were partly offset by positive valuation effects (due mostly to the increase in equity prices).
a. Some Recent Trends
The U.S.’s FA surplus should reduce its external wealth over time, ceteris paribus, although capital gains have mitigated the fall in wealth. However, the capital gains to the U.S. are capital losses to other countries.
4. What External Wealth Tells Us
External wealth tells us whether a country is a debtor or a creditor. A country can increase (decrease) its wealth by running CA surpluses (deficits). However, capital gains or losses can also change its wealth.
The measurement of a nation’s income flow is not the only important economic variable that must be adapted to the open-economy environment. Economists and policy makers, and the general public, also care about a nation’s stock of wealth. And so, probably, do you.
For example, Anne has income and expenditures of $50,000 each year and savings in the bank of $10,000. But she also has a credit card debt of $20,000. Beth’s life is identical to Anne’s in almost every respect: she has income and expenditures of $50,000 each year and savings of $10,000, but she has no credit card debt. Who is better off? Clearly, Beth is. Her income is the same as Anne’s. But Anne’s wealth or “net worth” is −$10,000 (savings of $10,000 minus debt of $20,000), whereas Beth has a net worth of +$10,000. Anne’s wealth is −20% of her income; Beth’s wealth is +20% of her income.
Starting with example of the individual makes the concept of external wealth intuitive and concrete.
Just as a household is better off with higher wealth, all else equal, so is a country. We can calculate a home country’s “net worth” or external wealth (W) with respect to the rest of the world (ROW) by adding up all of the home assets owned by ROW (foreigners’ claims against home) and then subtracting all of the ROW assets owned by the home country (home claims against foreigners). Doing this for the United States at the end of year 2012, we would find that the United States had an external wealth of about −$4,474 billion, according to preliminary BEA estimates. This made the United States the world’s biggest debtor in history at the time of this writing. The United States’ net debt to the ROW was about $14,250 for every American. Because GDP per person in the United States was about $50,000 in 2012, the external wealth of the U.S. was about −28.5% of GDP.
187
Why is U.S. external wealth at this level? How did it get there and what will happen next? To understand how the wealth levels of countries evolve, in this final section of the chapter we build on what we have learned from the national income and balance of payments accounts.
The Level of External Wealth
First, we give a definition of the level of a country’s external wealth (W):
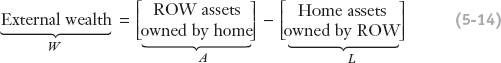
External wealth equals the value of total external assets (A) minus the value of total external liabilities (L). Total external assets is what the rest of the world owes to the home country, and total external liabilities is what the home country owes to the ROW. A country’s level of external wealth is also called its net international investment position or net foreign assets. It is a stock measure, not a flow measure.
If W > 0, the home country is a net creditor country: external assets exceed external liabilities, and what the rest of the world owes the home country is greater than what the home country owes to the rest of the world.
Emphasize the punch line.
If W < 0, the home country is a net debtor country: external liabilities exceed external assets, and what the home country owes to the rest of the world is greater than what the rest of the world owes to the home country.
Make sure students keep this in mind too.
External wealth is only one part of a nation’s total wealth. The other part of a nation’s wealth is internal wealth, which corresponds to the total value of all nonfinancial assets in the home country. (The links between external wealth and total wealth are explored further in the appendix to this chapter.)
Because we are focusing on international economic relationships, our main emphasis is on external wealth because it measures the outstanding obligations of one country to another. Those obligations, and when and how they are paid, can be the source of great economic and political stress. Moreover, the net debts of nations, like those of individuals, ultimately carry a cost. To understand external wealth, let’s look at how it is measured and how it evolves.
Changes in External Wealth
This was already implicit in our previous discussion of the CA and FA, but can now be related formally to wealth accumulate through equation 16-14.
There are two reasons a country’s level of external wealth changes over time.
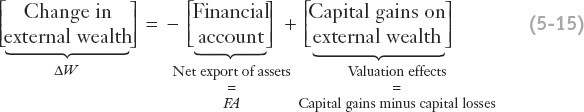
- Financial flows: As a result of asset trades, the country can increase or decrease its external assets and liabilities. How? Net exports of foreign assets cause an equal decrease in the level of external assets and hence a corresponding decrease in external wealth. Net exports of home assets cause an equal increase in the level of external liabilities and hence a corresponding decrease in external wealth. For example, if net exports of assets (whether home or foreign) are +$1 billion, then the change in external wealth is −$1 billion. The net export of assets of all kinds is measured by the financial account (FA), and this has a negative effect on external wealth in any period.
- Valuation effects: The value of existing external assets and liabilities may change over time because of capital gains or losses. In the case of external wealth, this change in value could be due to price effects or exchange rate effects. For example, suppose, a U.S. citizen buys 100 shares of BP on the London Stock Exchange at £7 each. Suppose the exchange rate is $1.5 per pound. These U.S. external assets are worth $10.50 each (1.5 times 7), for a total of $1,050. Suppose the price of these shares then falls to £6, and the exchange rate stays the same. Each share is now worth $9.00 (1.5 times 6) and the 100 shares are valued at $900. Their value has fallen in dollar terms by $150 (£1 times 1.5 times 100), which is a capital loss. This is an example of a price effect. Now suppose the exchange rate rises to $1.6 per pound. Each share is still worth £6 in U.K. currency but $9.60 in U.S. currency (1.6 times 6), so the total value of the shares rises to $960, which, relative to the $900 they were previously worth, implies a capital gain of $60. This is an example of an exchange rate effect. Similar effects can change the value of external liabilities.
This will be less clear to students at first, since some won't really know what capital gains or losses are. Do a couple of numerical examples like this.
Adding up these two contributions to the change in external wealth (ΔW), we find
We gain a deeper understanding of this expression if we recall the BOP identity: the current account plus the capital account plus the financial account equals zero. Hence, minus the financial account equals the current account plus the capital account, or −FA = CA + KA. Substituting this identity into Equation (5-15), we obtain

Wonderful! Put it just this way.
This fundamental formula tells us that a country can increase its external wealth in one of only three ways:
- Through its own thrift (a CA surplus, so expenditure is less than income)
- By the charity of others (a KA surplus, by receiving net gifts of wealth)
- With the help of windfalls (having positive capital gains)
Similarly, a country can reduce its external wealth by doing any of the opposites.
189
Understanding the Data on External Wealth
To track external wealth accurately, statisticians apply Equation (5-15). They face the challenge of not only keeping tabs on every trade in assets but also correctly assessing the impact of changing financial market conditions around the world on the value of the country’s external assets and liabilities.
Measures of levels and changes in national external wealth are tabulated in an account known as the net international investment position. To illustrate with an example, a simplified version of this account for the United States appears in Table 5-3. The latest detailed data for the year 2012 show a clear distinction between the contribution of financial flows to changes in external wealth—net trade in assets, in column (a)—and the impact of various kinds of valuation effects—columns (b), (c), and (d).
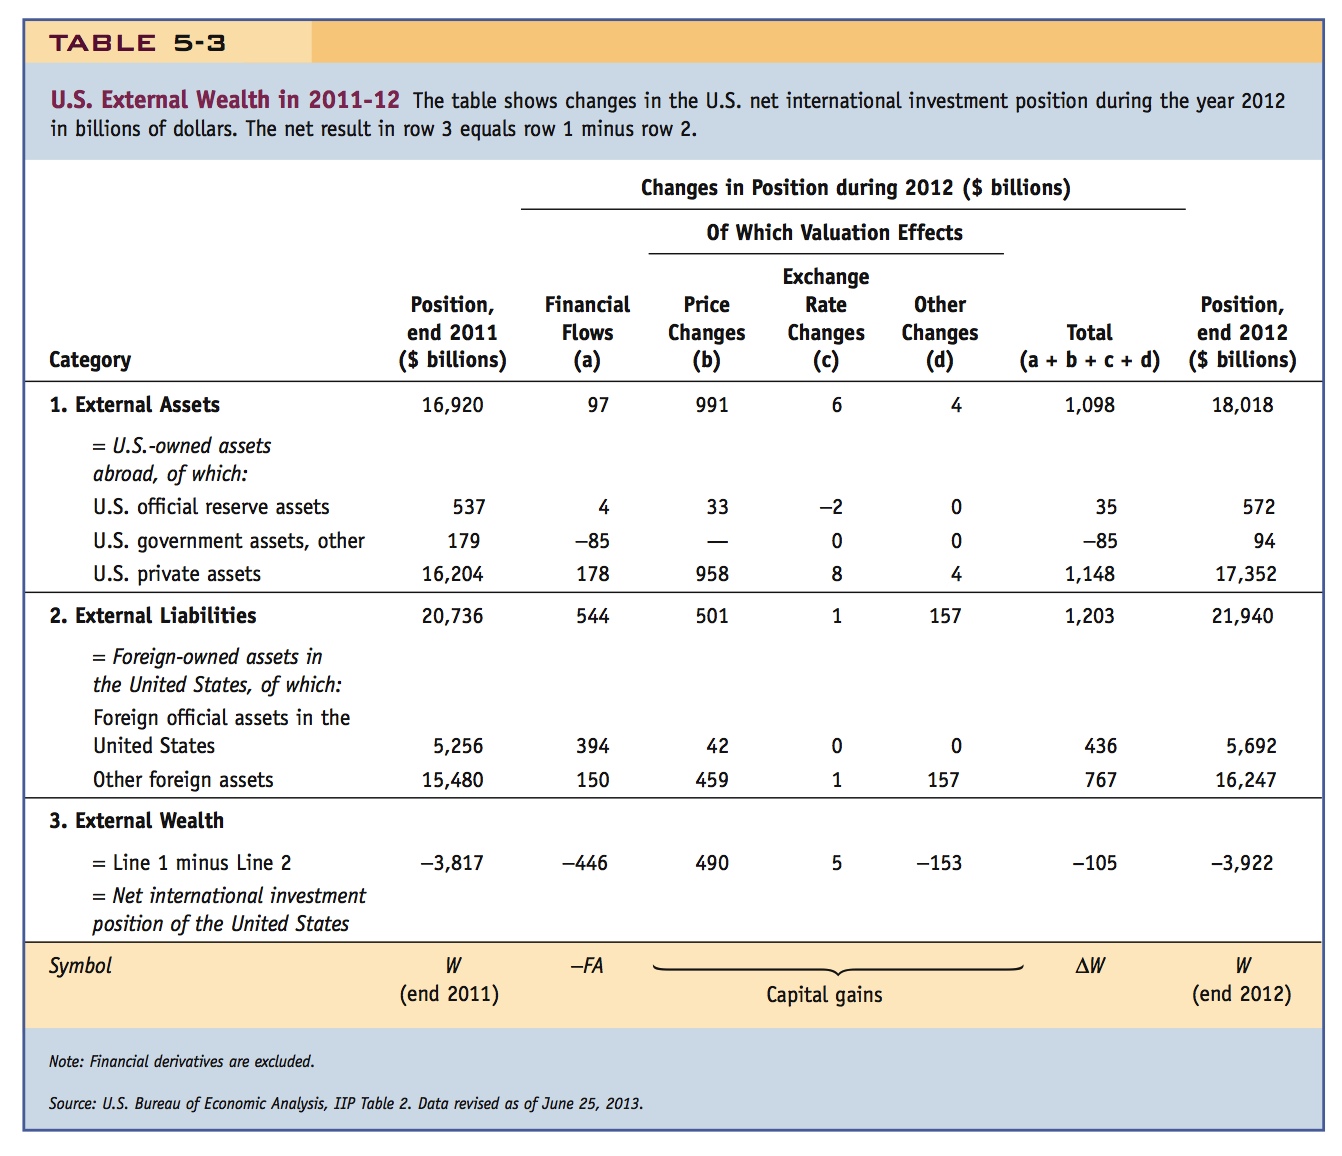
Table 5-3, line 3, column (a), shows that in 2012 the United States, on net, exported $446 billion in assets (net exports of $544 billion of U.S. assets on line 3, minus net imports of $97 billion of foreign assets on line 1). On their own, these financial flows would have reduced U.S. external wealth by $446 billion in just one year. Yet the actual change in external wealth was much smaller in that year due to positive valuation effects of +$341 billion in columns (b), (c), and (d) which mitigated the decline U.S. external wealth over the same period. These valuation effects were mainly driven by +$490 billion in price change effects and only +$5 billion in exchange rate effects. “Other” changes are recorded as −$153 billion. Thus, while the United States borrowed an additional $446 billion from various nations in 2012, its external wealth actually fell by only $105 billion as shown by the total change on line 3.
190
So what happened in 2012? The value of the U.S. dollar changed very little against foreign currencies, and hence exchange rate effects were tiny. The main factor was that equity values were rising worldwide (about 15%). However, U.S. external assets include a larger share of higher-risk equities than U.S. external liabilities, which consist of a great deal of lower-risk U.S. debt. This difference in the composition of the two portfolios meant that rising equity markets tended to raise the value of U.S. external assets (which went up about 6% in value) much more than U.S. external liabilities (which went up about 2.5%). In addition, U.S. external liabilities include vast foreign holdings of U.S. Treasury securities, held either as foreign official assets in central banks or as low-risk assets by foreign investors. These dollar-denominated assets tended to have a stable value in 2012 as interest rates on U.S. debt remained low and changed very little from the start to the end of the year.14
Some Recent Trends Over the longer run, the changes in external wealth in Equation (5-16) gradually accumulate. In the case of the United States, for the past three decades, the financial account has been almost always in surplus, reflecting a net export of assets to the rest of the world to pay for chronic current account deficits (the capital account has been negligibly small).
Draw the implication that while CA imbalances are important for changes in wealth, valuation effects can also have surprisingly large effects.
If there had been no valuation effects, then Equation (5-15) would make a simple prediction. The change in the level of external wealth between two dates should equal the cumulative net import of assets (minus the financial account) over the intervening period. For example, if we had taken the U.S. external wealth level at the end of 1988 and added to that level all subsequent financial flows for the next 24 years until the end of 2012, we would have estimated U.S. external wealth in 2012 at about −$8,000 billion, which would have been a massive net debtor position (exceeding −50% of GDP). In reality, the actual 2011 figure for external wealth was a lot smaller: only −$4 trillion (−$3,922 billion as shown in Table 5-3).
Why? Valuation effects or capital gains generated the difference of $4 trillion in external wealth over the period from 1988 to 2012, and when added up these effects reduced U.S. net external indebtedness in 2012 by almost one-half compared with the level that financial flows alone would have predicted. The flip side of these valuation effects is that the rest of the world outside the United States suffered an equal and opposite capital loss over the same period. Why? Capital gains always have a “zero sum” property—by symmetry, an increase in the dollar value of the home country’s external assets is simultaneously an increase in the dollar value of the rest of the world’s external liabilities.
191
What External Wealth Tells Us
External wealth data tell us the net credit or debit position of a country with respect to the rest of the world. They include data on external assets (foreign assets owned by the home country) and external liabilities (home assets owned by foreigners). A creditor country has positive external wealth, a debtor country negative external wealth.
What drives external wealth? The current account told us about the imbalances in a country’s external flows of goods, services, factor services, and income. The balance of payments accounts told us how these imbalances require offsetting financial flows of assets between countries. Countries with a current account surplus (deficit) must be net buyers (sellers) of assets. This buying and selling of assets has implications for external wealth. An increase in a country’s external wealth results from every net import of assets; conversely, a decrease in external wealth results from every net export of assets. In addition, countries can experience capital gains or losses on their external assets and liabilities that cause changes in external wealth. All of these changes are summarized in the statement of a country’s net international investment position.