PROBLEMS
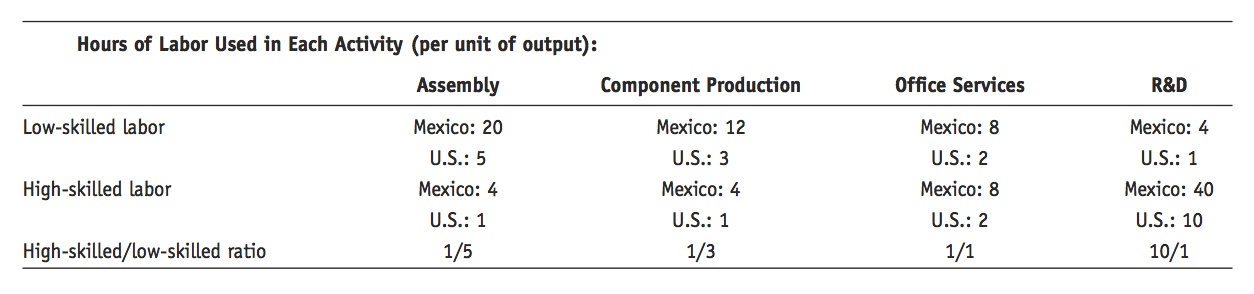
- Consider an offshoring model in which the hours of labor used in four activities in the United States and Mexico are as follows: Note that labor hours in Mexico are twice those in the United States, reflecting Mexico’s lower productivity. Also note that the ratio of high-skilled to low-skilled labor used in each activity increases as we move to the right, from 1/5 in assembly, to 10/1 in R&D. Suppose that the wage of U.S. low-skilled workers is $10 per hour and that of high-skilled workers is $25 per hour, and that the wage of Mexican low-skilled workers is $1 per hour and that of high-skilled workers is $5 per hour (these values are made up to be convenient, not realistic). Also suppose that the trade costs are 25%, 30%, or 50%, which means that an additional 25%, 30%, or 50% is added to the costs of offshoring to Mexico.
Question
Fill in the blank cells in the following table by computing the costs of production of each activity in each country (two cells are filled in for you):
 Prob 7 1a. Fill in the blank cells in the following table by computing the costs of production of each activity in each country (two cells are filled in for you):
Question
With trade costs of 50%, where is the value chain sliced? That is, which activities are cheaper to import from Mexico and which are cheaper to produce in the United States?
Prob 7 1b. With trade costs of 50%, where is the value chain sliced? That is, which activities are cheaper to import from Mexico and which are cheaper to produce in the United States?Question
With trade costs of 30%, and then 25%, where is the value chain sliced?
Prob 7 1c. With trade costs of 30%, and then 25%, where is the value chain sliced?
- Consider an offshoring model in which Home’s skilled labor has a higher relative wage than Foreign’s skilled labor and in which the costs of capital and trade are uniform across production activities.
Question
Will Home’s offshored production activities be high or low on the value chain for a given product? That is, will Home offshore production activities that are skilled and labor-intensive, or low-skilled and labor-intensive? Explain.
Prob 7 2a. Will Home’s offshored production activities be high or low on the value chain for a given product? That is, will Home offshore production activities that are skilled and labor-intensive, or low-skilled and labor-intensive? Explain.Question
Suppose that Home uniformly increases its tariff level, effectively increasing the cost of importing all goods and services from abroad. How does this affect the slicing of the value chain?
Prob 7 2b. Suppose that Home uniformly increases its tariff level, effectively increasing the cost of importing all goods and services from abroad. How does this affect the slicing of the value chain?Question
Draw relative labor supply and demand diagrams for Home and Foreign showing the effect of this change. What happens to the relative wage in each country?
Prob 7 2c. Draw relative labor supply and demand diagrams for Home and Foreign showing the effect of this change. What happens to the relative wage in each country?
- Consider a U.S. firm’s production of automobiles, including research and development and component production.
Question
Starting from a no-trade equilibrium in a PPF diagram, illustrate the gains from offshoring if the United States has a comparative advantage in component production.
Prob 7 3a. Starting from a no-trade equilibrium in a PPF diagram, illustrate the gains from offshoring if the United States has a comparative advantage in component production.Question
Now suppose that advances in engineering abroad decrease the relative price of research and development. Illustrate this change on your diagram and state the implications for production in the United States.
Prob 7 3b. Now suppose that advances in engineering abroad decrease the relative price of research and development. Illustrate this change on your diagram and state the implications for production in the United States.Question
Does the U.S. firm gain from advances in research and development abroad? Explain why or why not.
Prob 7 3c. Does the U.S. firm gain from advances in research and development abroad? Explain why or why not.
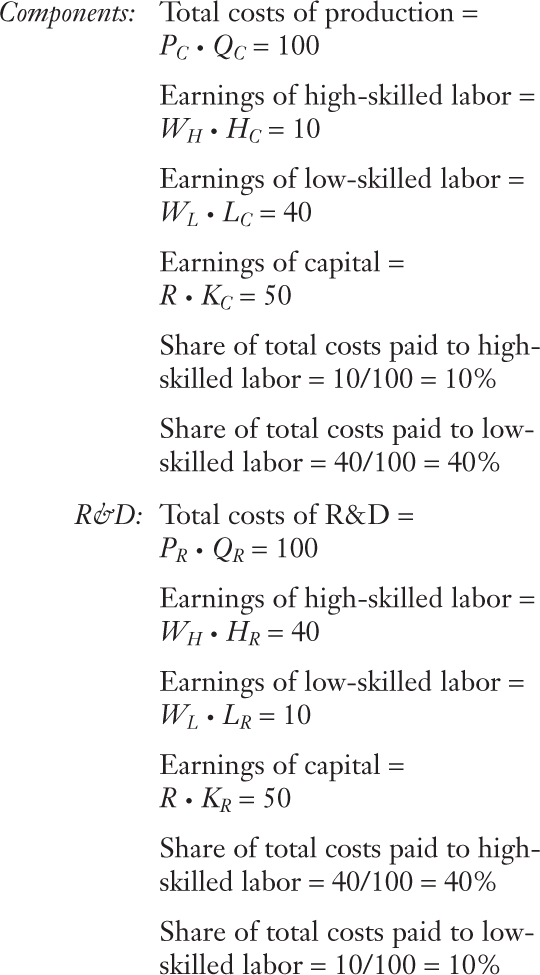
- Consider the model of a firm that produces final goods using R&D and components as inputs, with cost data as follows:
Question
In which factor(s) is components intensive? In which factor(s) is R&D intensive?
Prob 7 4a. In which factor(s) is components intensive? In which factor(s) is R&D intensive?Question
Suppose that due to the opening of trade, the price of components fall by ΔPC/PC = −10%, while the price of R&D remains unchanged, ΔPR/PR = 0. Using the hint below, calculate the change in the wage of skilled and low-skilled labor.
Hint: We follow a procedure similar to that used in Chapter 4 when calculating the change in factor prices in the Heckscher-Ohlin model.First, write the total costs in each activity as consisting of the payments to labor and capital:PC · QC = R · KC + WH · HC + WL · LC, for components
PR · QR = R · KR + WH · HR + WL · LR, for R&D
Because we assume that 50% of costs in either components or R&D is always paid to capital, then R · KC = 0.5(PC · QC) and R · KR = 0.5(PR · QR), so we can rewrite the above two equations as
0.5(PC · QC) = WH · HC + WL · LC, for components
0.5(PR · QR) = WH · HR + WL · LR, for R&D
Taking the change in these equations:
0.5(ΔPC · QC) = ΔWH · HC + ΔWL · LC, for components
0.5(ΔPR · QR) = ΔWH · HR + ΔWL · LR, for R&D
Dividing the equations by (ΔPC · QC) and (ΔPR · QR), respectively, we can rewrite the equations as
Use the cost shares and price change data in these formulas to get
Now solve these two equations for the change in the high-skilled wage (ΔWH/WH), and the change in the low-skilled wage (ΔWL/WL).Prob 7 4b. Suppose that due to the opening of trade, the price of components fall by ΔPC/PC = −10%, while the price of R&D remains unchanged, ΔPR/PR = 0. Using the hint below, calculate the change in the wage of skilled and low-skilled labor.Question
What has happened to the relative wage of high-skilled/low-skilled labor? Does this match the predictions of the offshoring model in this chapter?
Prob 7 4c. What has happened to the relative wage of high-skilled/low-skilled labor? Does this match the predictions of the offshoring model in this chapter?
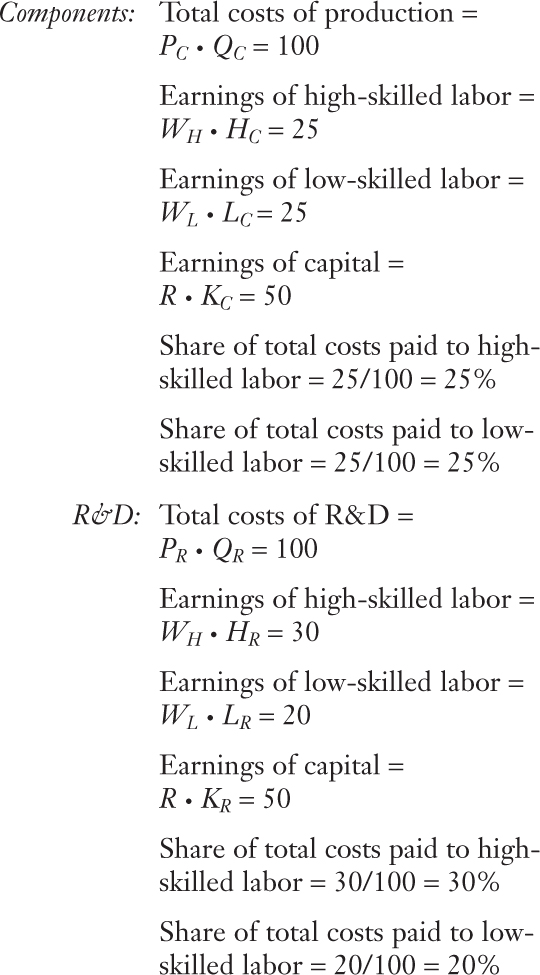
- Consider the model of a firm that produces final goods using R&D and components as inputs, with cost data as follows:
Question
In which factor(s) is components intensive? In which factor(s) is research intensive?
Prob 7 5a. In which factor(s) is components intensive? In which factor(s) is research intensive?Question
Suppose that due to the opening of trade, the relative price of R&D increases, ΔPR/PR = 10%, whereas the price of components stays unchanged, ΔPC/PC = 0. Calculate the change in the relative wage of high-skilled and low-skilled labor.
Prob 7 5b. Suppose that due to the opening of trade, the relative price of R&D increases, ΔPR/PR = 10%, whereas the price of components stays unchanged, ΔPC/PC = 0. Calculate the change in the relative wage of high-skilled and low-skilled labor.Question
What has happened to the relative wage of high-skilled/low-skilled labor? How does this result compare to Problem 4, and explain why it is similar or different.
Prob 7 5c. What has happened to the relative wage of high-skilled/low-skilled labor? How does this result compare to Problem 4, and explain why it is similar or different.
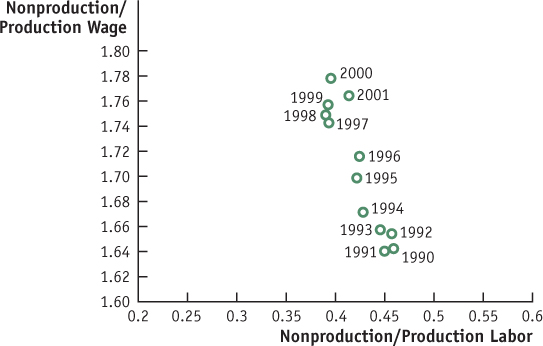
- The following diagram shows what happened to the relative wage and relative demand for skilled labor in the U.S. manufacturing sector during the 1990s. These points are plotted using the data from Figures 7-5 and 7-6. To interpret this diagram, let us think about the offshoring of service activities done by nonproduction workers.
Question
Suppose that the nonproduction workers providing service activities being offshored, such as call centers, earn a lower wage in the United States than other nonproduction workers. As the amount of offshoring increases, what will happen to the average wage of the nonproduction workers remaining in the United States? What happens to the relative wage of nonproduction/production workers? Is this outcome consistent with the diagram?
Prob 7 6a. Suppose that the nonproduction workers providing service activities being offshored, such as call centers, earn a lower wage in the United States than other nonproduction workers. As the amount of offshoring increases, what will happen to the average wage of the nonproduction workers remaining in the United States? What happens to the relative wage of nonproduction/production workers? Is this outcome consistent with the diagram?Question
As the service activities are offshored, what happens to the U.S. employment of nonproduction workers? What happens to the relative employment of nonproduction/production workers? Is this outcome also consistent with the diagram?
Prob 7 6b. As the service activities are offshored, what happens to the U.S. employment of nonproduction workers? What happens to the relative employment of nonproduction/production workers? Is this outcome also consistent with the diagram?
Question
Read the following excerpt, and using what you have learned in this chapter, discuss how offshoring creates opportunities for the countries involved.
Sudhakar Shenoy, chief executive of Information Management Consultants (IMC) in Reston, makes an effective pitch for offshoring.
Several years ago IMC saw a market developing for software that would allow biotech companies to make better and faster use of the new human genome research. Doing it here, Shenoy calculated, would cost several million dollars, which he figured would have priced the product too high for most customers. But by having a small group of engineers at IMC’s Indian subsidiary do much of the coding work, he was able to bring the project in at $500,000. The result: IMC now has a thriving line of business in bioinformatics, with major clients and a growing payroll of six-figure PhDs here. And there are more engineers than ever—six here for every one in India.
But that’s only part of the good-news story. In Pune, where IMC’s Indian operations are located, an airport under construction will require lots of U.S. engineering, design and electronics. At the same time, IMC’s Indian engineers, who earned annual salaries of $3,500 a decade ago, now command up to $12,000—enough to buy all manner of imported consumer goods.
Source: Excerpted from Steven Pearlstein, “Still Short of the Offshoring Ideal,” Washington Post, March 12, 2004.Prob 7 7. Read the following excerpt, and using what you have learned in this chapter, discuss how offshoring creates opportunities for the countries involved.- The quote from the 2004 Economic Report of the President at the beginning of the chapter generated a lot of controversy that year, as discussed at the beginning of section 3 here. The chairman of the Council, N. Gregory Mankiw, made the following additional comments in a speech while presenting the report: “Outsourcing is just a new way of doing international trade. More things are tradable than were tradable in the past, and that’s a good thing.”
Those statements quickly led to reactions from both Democratic and Republican members of Congress. Tom Daschle, then the Democratic Senate minority leader, said, “If this is the administration’s position, they owe an apology to every worker in America.” Dennis Hastert, then Republican Speaker of the House, said, “Outsourcing can be a problem for American workers and the American economy.” John Kerry, the 2004 Democratic presidential candidate, referred to businesses that offshored as “Benedict Arnold corporations.” In response, Mankiw clarified his earlier comments: “My lack of clarity left the wrong impression that I praised the loss of U.S. jobs.”
Although you might feel that these statements just represented a squabble between politicians trying to score points during a presidential campaign, it is still worth trying to sort out who gains and who loses from offshoring.
Question
Why does Mankiw say that “outsourcing is a good thing”? Who is it good for in the United States? Are there overall gains for the United States? Explain with a diagram.
Prob 7 8a. Why does Mankiw say that “outsourcing is a good thing”? Who is it good for in the United States? Are there overall gains for the United States? Explain with a diagram.Question
Later in this chapter, Paul Samuelson is quoted as saying that there is no “necessary surplus of winnings over losings” due to offshoring. Use Figure 7-12 to carefully explain why Samuelson says this.
Prob 7 8b. Later in this chapter, Paul Samuelson is quoted as saying that there is no “necessary surplus of winnings over losings” due to offshoring. Use Figure 7-12 to carefully explain why Samuelson says this.
- In Figure 7-11, we saw that a fall in the relative price of components leads to an increase in the amount of components imported but that the amount of R&D exported from Home does not necessarily increase. To explore this further, complete the following:
Question
Let the relative price of components continue to fall in Figure 7-11, and show in a graph what happens to the equilibrium point on the isoquant for the final good.
Prob 7 9a. Let the relative price of components continue to fall in Figure 7-11, and show in a graph what happens to the equilibrium point on the isoquant for the final good.Question
Now draw another graph that has the relative price of components on the vertical axis and the imports of components on the horizontal axis. Start at the no-trade relative price of components, where imports are zero. Then label the various world relative prices of components on the vertical axis, and graph the quantity of imports at each price. Can we be sure that the import demand curve slopes downward?
Prob 7 9b. Now draw another graph that has the relative price of components on the vertical axis and the imports of components on the horizontal axis. Start at the no-trade relative price of components, where imports are zero. Then label the various world relative prices of components on the vertical axis, and graph the quantity of imports at each price. Can we be sure that the import demand curve slopes downward?Question
Now draw a new graph that has the relative price of R&D on the vertical axis and the exports of R&D on the horizontal axis. Start at the no-trade relative price of R&D, where exports are zero. Then label the various world relative prices of R&D on the vertical axis, and graph the quantity of exports at each price. When the relative price of R&D is high enough, what do you notice about the export supply curve?
Prob 7 9c. Now draw a new graph that has the relative price of R&D on the vertical axis and the exports of R&D on the horizontal axis. Start at the no-trade relative price of R&D, where exports are zero. Then label the various world relative prices of R&D on the vertical axis, and graph the quantity of exports at each price. When the relative price of R&D is high enough, what do you notice about the export supply curve?
Question
Why might it be relatively easier for a developing country like India to export service activities through offshoring than to participate in the global economy by producing manufacturing components?
Prob 7 10. Why might it be relatively easier for a developing country like India to export service activities through offshoring than to participate in the global economy by producing manufacturing components?Question
It is widely noted that even though China is the favored destination for manufacturing offshoring, it is far behind India in the business of offshored services. What differences between these two countries might account for this observation?
Prob 7 11. It is widely noted that even though China is the favored destination for manufacturing offshoring, it is far behind India in the business of offshored services. What differences between these two countries might account for this observation?