Chapter 4Figure It Out 9.3
4.1 Screen 1 of 4
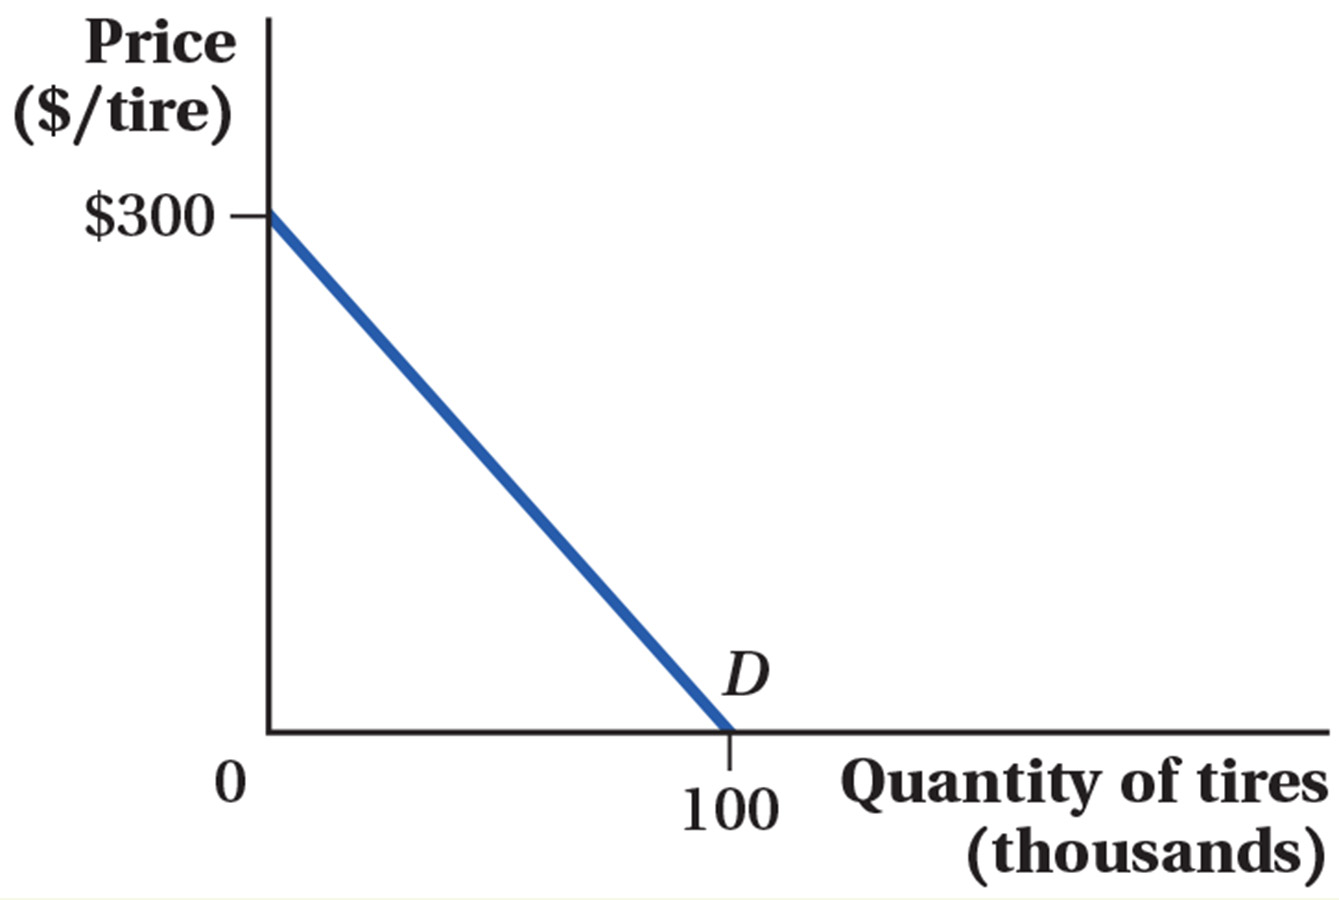
The Power Tires Company has market power and faces the demand curve shown in the figure below. The firm’s marginal cost curve is MC = 30 + 3Q.
a. Which of the following represents Power Tires’ marginal revenue?
| A. |
| B. |
| C. |
| D. |
4.2 Screen 2 of 4
b. What is the firm’s profit-maximizing output and price?
The firm’s profit maximizing output is
The firm’s profit maximizing price is $
4.3 Screen 3 of 4
c. If the firm’s demand changes to P = 240 – 2Q while its marginal cost remains the same, what is the firm’s profit-maximizing level of output and price? How does this compare to your answer for part (b)?
The firm’s new profit maximizing output is
The firm’s new profit maximizing price is $
4.4 Screen 4 of 4
How does the shape of the demand curve affect the firm’s ability to charge a high price?
| A. |
| B. |
| C. |
| D. |