Chapter 1. Signal Detection Experiment
1.1 Title slide

Signal Detection Experiment
Participate in a typical signal detection experiment in which you try to detect visual targets against a "noisy" background.
CLICK ANYWHERE TO BEGIN
Photo: Ali Kabas/Alamy
What Does a Signal Detection Experiment Reveal?
For example, in an experiment with 100 trials, a target was presented in 50 trials, and no target was presented in the other 50 trials, randomly intermixed. Suppose a participant had 29 hits, 16 false alarms, 21 misses, and 34 correct rejections. A hit was possible in the 50 trials in which a target was presented, and the actual number of hits was 29, so the percentage of hits, or the hit rate, was 29/50, or 58%. Similarly, the miss rate was 21/50, or 42%; the false alarm rate was 16/50, or 32%; and the correct rejection rate was 34/50, or 68%. Note that the sum of the hit rate and the miss rate must equal 1.0, or 100%, and so must the sum of the false alarm rate and the correct rejection rate.
To view the results of this type of experiment graphically, we can plot the hit rate against the false alarm rate on a graph called a receiver operating characteristic (ROC), as shown:
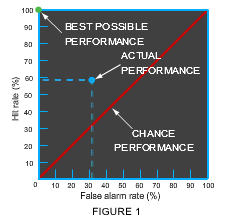
The blue point corresponds to the result of the example experiment. The green point represents the best possible performance. The red line marks all the points at which the hit rate equals the false alarm rate, as if the participant were just guessing. In general, then, the quality of a participant's performance in a signal detection experiment can be judged by where the point representing the participant's performance falls on an ROC plot: the closer to the top and left of the graph, the better the performance.
However, in a signal detection experiment, participants' performance depends not just on their perceptual sensitivity, but also on their decision-making style. Some participants might have a liberal style and report perceiving a target if there's the slightest hint that one was presented, whereas other participants might have a conservative style and report perceiving a target only if they're quite sure one was presented. Nevertheless, the results of a signal detection experiment can be used to measure an individual's perceptual sensitivity apart from the effects of their decision-making style, as illustrated by the ROC plot below:
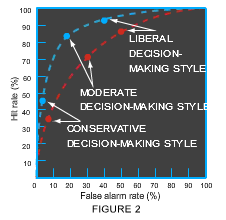
The two curves in this graph represent two participants with different perceptual sensitivities, where the blue curve indicates greater sensitivity. On each curve, the three plotted points show how the participant’s performance would change as the participant adopted a conservative, moderate, or liberal decision-making style.
Note that when an individual's decision-making style changes, the data point appears in a different location on the individual's ROC curve—but the ROC curve itself doesn't change. Thus, an ROC curve as a whole represents an individual's perceptual sensitivity regardless of decision-making style. The ROC curve of a participant with higher sensitivity will always be closer to the upper-left corner of the graph than the curve of a participant with lower sensitivity.
1.2 Explain
Signal Detection Experiment
In this demonstration, you'll be a participant in a signal detection experiment designed to assess your sensitivity to a low-contrast visual stimulus (the signal, or target) and to assess your decision-making style.
The target will be a "full moon" in a cloudy night sky seen through a window. In any given trial, a target might be present or absent in the scene. If present, the target might be partly hidden by other elements in the scene. Your task in each trial will be to indicate whether or not you detected a target. The scene will be displayed very briefly, so you'll have to scan the scene quickly, looking for a target. Keep in mind that the basic scene will be exactly the same in every trial, unless a target stimulus is present. This means that you can detect the target by detecting a change in this basic scene.
The experiment is divided into two parts
In Part 1, the sky will be cloudy but without any other elements that might hide the target. This means that the target will be relatively easy to detect.
In Part 2, the scene will be noisier, with rain falling and with tree branches, making the target harder to detect.
1.3 Explain
Signal Detection Experiment
Part 1
To get an idea of your task in Part 1 of this experiment, look at the two partial scenes at right, in each of which the target is present (identified by an orange arrow). In the scene on the left, the target is mostly in view. In the scene on the right, the target is obscured by clouds.
In each trial, you'll see the scene very briefly. Then you'll be asked to press Z if you detected the target or / if you didn’t detect the target.
There will be a total of 32 trials.
When you're ready
press the space bar to see Trial 1.

1.4 Explain

a target.
a target.
After your key press, the next trial will start automatically.
Trial 1 of 32


1.5 Explain
Signal Detection Experiment
Part 1 Results

The table on the right shows your results in Part 1 of this signal detection experiment, which consisted of 32 trials. In 16 trials, a target (full moon) was presented. In the other 16 trials, no target was presented. After each trial, you responded by indicating whether or not you thought a target had been presented. Because there were two possible presentations and two possible responses (a target was presented or not, and you reported a target or not), each trial had one of four possible outcomes:

Hit: A target was presented, and you reported it.

Miss: A target was presented, but you failed to report it.
False Alarm: A target wasn't presented, but you mistakenly reported a target.
Correct Rejection: A target wasn't presented, and you didn't report a target.
Advance to next screen to see your results in the form of an ROC plot.
(Hit rate = 16/16 = 100.00%)
(False alarm rate = 16/16 = 100.00%)
(Miss rate = 16/16 = 100.00%)
(Correct rejection rate = 16/16 = 100.00%)
Your Part 1 results cannot be displayed
because you didn't complete all 32 trials.
To complete Part 1, you must start over from Trial 1.
1.6 Explain
Signal Detection Experiment
Part 1 Results: ROC Plot
The graph at the right shows your Part 1 results in the form of an ROC plot (the yellow point), in which your hit rate is plotted against your false alarm rate.
Your perceptual sensitivity to the target is indicated by the location of your results in relation to the best possible results (the green point, at the upper-left corner of the graph). The greater your sensitivity to the target, the closer your results will be to the best possible results.
The curve shows how your results could vary depending on your decision-making style:
• If you had used a more liberal style (i.e., if you had been more willing to say you had detected a target when you weren't really sure), your data point would have been higher and further to the right on the curve.
• If you had used a more conservative style (i.e., if you had been less willing to say you had detected a target when you weren't really sure), your data point would have been lower and further to the left on the curve.
The diagonal line represents chance results: the hit rate equals the false alarm rate, as if the participant were just guessing. See the Explain screen for a more detailed explanation.
Your Part 1 results cannot be displayed
because you didn't complete all 32 trials.
To complete Part 1, you must start over from Trial 1.
1.7 Explain
Signal Detection Experiment
Part 2
In Part 2 of this experiment, the presence or absence of the target will be harder to detect than in Part 1, because raindrops and tree branches, as well as clouds, can hide the target. To get an idea of what this means, look at the two partial scenes at right, in each of which the target is present (identified by an orange arrow). In the scene on the left, the target is in almost full view. In the scene on the right, the target is much more hidden.
In each trial, you'll see the scene very briefly. Then you'll be asked to press Z if you detected the target or / if you didn’t detect the target.
There will be a total of 32 trials.
When you're ready
press the space bar to see Trial 2.

1.8 Explain
a target.
a target.
After your key press, the next trial will start automatically.
Trial 1 of 32

1.9 Explain
Signal Detection Experiment
Part 2 Results

Compare your results in Part 2 of this signal detection experiment to your results in Part 1.
Hit: A target was presented, and you reported it.
Miss: A target was presented, but you failed to report it.
False Alarm: A target wasn't presented, but you mistakenly reported a target.
Correct Rejection: A target wasn't presented, and you didn't report a target.
Advance to next screen to see your results in the form of an ROC plot.
Part 2
Results
(Hit rate = 16/16 = 100.00%)
(False alarm rate = 16/16 = 100.00%)
(Miss rate = 16/16 = 100.00%)
(Correct rejection rate = 16/16 = 100.00%)
Your Part 2 results cannot be displayed
because you didn't complete all 32 trials.
To complete Part 2, you must start over from Trial 1.
Part 1
Results
(Hit rate = 16/16 = 100.00%)
(False alarm rate = 16/16 = 100.00%)
(Miss rate = 16/16 = 100.00%)
(Correct rejection rate = 16/16 = 100.00%)
Your Part 1 results cannot be displayed
because you didn't complete all 32 trials.
To complete Part 1, you must start over from Trial 1.
1.10 Explain
Signal Detection Experiment
Part 2 Results: ROC Plot
The graph at the right shows your Part 2 results in the form of an ROC plot (the orange point), compared to your Part 1 results (the yellow point).
Your perceptual sensitivity to the target is indicated by the location of your results in relation to the best possible results (the green point, at the upper-left corner of the graph). The greater your sensitivity to the target, the closer your results will be to the best possible results.
The curves for Part 1 and Part 2 show how your results could vary depending on your decision-making style:
• If you had used a more liberal style (i.e., if you had been more willing to say you had detected a target stimulus when you weren't really sure), your data point would have been higher and further to the right on the curve.
• If you had used a more conservative style (i.e., if you had been less willing to say you had detected a target stimulus when you weren't really sure), your data point would have been lower and further to the left on the curve.
The diagonal line represents chance results: the hit rate equals the false alarm rate, as if the participant were just guessing. See the Explain screen for a more detailed explanation.
Your results cannot be displayed because you didn't
complete all 32 trials in Part 1 and didn't complete
all 32 trials in Part 1, you must start over from Trial 1.
Your Part 1 results cannot be displayed because you didn't complete all 32 trials. To complete Part 1, you must start over from Trial 1.
Your Part 2 results cannot be displayed because you didn't complete all 32 trials. To complete Part 2, you must start over from Trial 2.
1.11 Explain
What Does a Signal Detection Experiment Reveal?
In a typical experiment based on signal detection theory, a stimulus (a signal, or target) is presented in some trials, and no target is presented in others. In each trial, participants respond by indicating whether they perceived a target or not. Each response can be classified as belonging to one of four categories: hit, miss, false alarm, or correct rejection. Hits and correct rejections are correct responses; false alarms and misses are errors. The purpose of such an experiment is to measure participants' perceptual sensitivity.
For example, in an experiment with 100 trials, a target was presented in 50 trials, and no target was presented in the other 50 trials, randomly intermixed. Suppose a participant had 29 hits, 16 false alarms, 21 misses, and 34 correct rejections. A hit was possible in the 50 trials in which a target was presented, and the actual number of hits was 29, so the percentage of hits, or the hit rate, was 29/50, or 58%. Similarly, the miss rate was 21/50, or 42%; the false alarm rate was 16/50, or 32%; and the correct rejection rate was 34/50, or 68%. Note that the sum of the hit rate and the miss rate must equal 1.0, or 100%, and so must
the sum of the false alarm rate and the correct rejection rate.
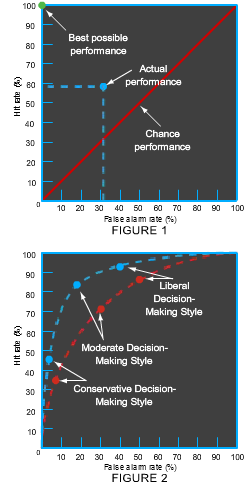
To view the results of this type of experiment graphically, we can plot the hit rate against the false alarm rate on a graph called a receiver operating characteristic (ROC), as shown in Figure 1.
The blue point corresponds to the result of the example experiment. The green point represents the best possible performance. The red line marks all the points at which the hit rate equals the false alarm rate, as if the participant were just guessing. In general, then, the quality of a participant's performance in a signal detection experiment can be judged by where the point representing the participant's performance falls on an ROC plot: the closer to the top and left of the graph, the better the performance.
However, in a signal detection experiment, participants' performance depends not just on their perceptual sensitivity, but also on their decision-making style. Some participants might have a liberal style and report perceiving a target if there's the slightest hint that one was presented, whereas other participants might have a conservative style and report perceiving a target only if they're quite sure one was presented. Nevertheless, the results of a signal detection experiment can be used to measure an individual's perceptual sensitivity apart from the effects of their decision-making style, as illustrated by the ROC plot in Figure 2.
The two curves in this graph represent two participants with different perceptual sensitivities, where the blue curve indicates greater sensitivity. On each curve, the three plotted points show how the participant’s performance would change as the participant adopted a conservative, moderate, or liberal decision-making style.
Note that when an individual's decision-making style changes, the data point appears in a different location on the individual's ROC curve—but the ROC curve itself doesn't change. Thus, an ROC curve as a whole represents an individual's perceptual sensitivity regardless of decision-making style. The ROC curve of a participant with higher sensitivity will always be closer to the upper-left corner of the graph than the curve of a participant with lower sensitivity.
1.12 Test - single choice
Select your answer to the question below. Then click SUBMIT.
What are the results of a signal detection experiment useful for?
1.13 Test - single choice
Select your answer to the question below. Then click SUBMIT.
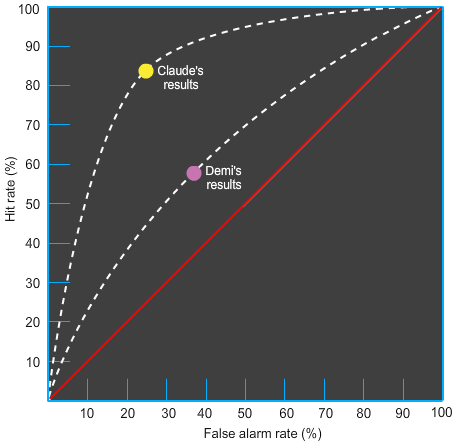
On the graph, the yellow dot represents Claude's results in a signal detection experiment, and the purple dot represents Demi's results. Based on this graph, which of the statements is true?
1.14 Test - single choice
Select your answer to the question below. Then click SUBMIT.
The results of a signal detection experiment can be expressed in terms of the hit rate and the false alarm rate. Why isn't it also necessary to state the miss rate and the correct rejection rate?
1.15 Test - single choice
Select your answer to the question below. Then click SUBMIT.
In a signal detection experiment, Eduardo’s hit rate was 100%. Which of the following is not a possible explanation for this result?
1.16 Activity completed
Signal Detection Experiment.