Chapter 1. Orientation Tuning of Simple Cells in V1, and Population Coding
1.1 Title slide
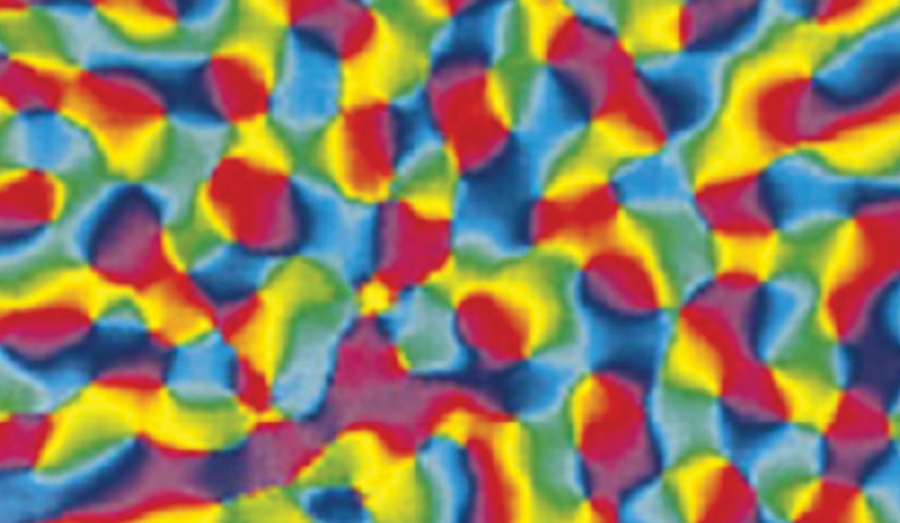
Orientation Tuning of Simple Cells in V1, and Population Coding
Control the orientation and contrast of stimuli on the receptive field of a simple cell to measure its orientation tuning curve.
CLICK ANYWHERE TO BEGIN
[From Bosking et al., 1997]
How Does the Visual System Use the Responses of Multiple Simple Cells in V1 to Determine the Orientation of Visual Stimuli?
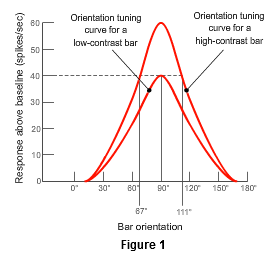
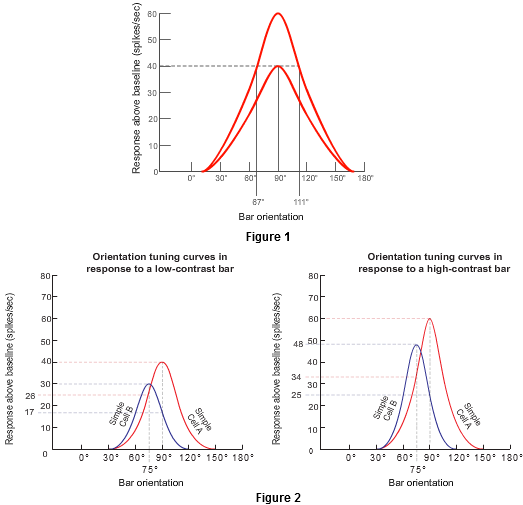
In this graph, the horizontal dashed line shows that three different stimuli could evoke a response of 40 spikes/sec above baseline from this cell:
- A high-contrast bar oriented at 67°.
- A low-contrast bar oriented at 90°.
- A high-contrast bar oriented at 111°.
Thus, it would be impossible for the visual system to "know" the orientation of the bar based just on a 40 spikes/sec response by this single cell. However, any relatively small area on the retina contains the receptive fields of a population of many simple cells, covering the full range of preferred orientations. Figure 2, which shows the orientation tuning curves of two simple cells (A and B) with receptive fields at the same location on the retina, indicates how the visual system uses this to solve the problem of unambiguously determining orientation.
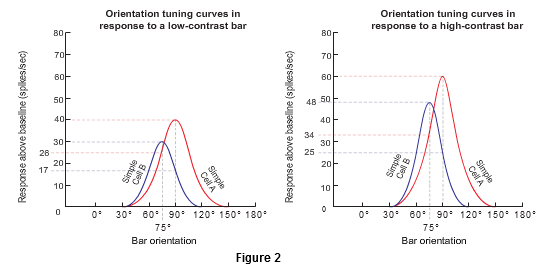
Consider the responses of cells A and B to low- and high-contrast bars oriented at 75° or 90°, as shown in the following table:
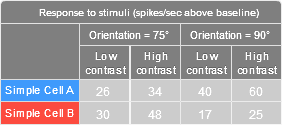
Thus, for a 90° bar the response of cell A is greater than the response of cell B, regardless of contrast. But for a 75° bar, the pattern is reversed: the response of cell B is greater than the response of cell A, regardless of contrast.
This type of patterning of the relative responses of neurons with different orientation tuning curves is called a population code, because the response patterns of a population of differently tuned neurons function as a code that lets the visual system compute the orientation of a bar of light.
1.2 Explain - Custom activity
Click on a low-contrast or high-contrast stimulus to project it onto the receptive field of
a simple cell in V1. You'll see the cell's response in the table
and as a plotted point in the graph. Note how the cell's response depends
on both the contrast and the orientation of the stimulus.
Click SHOW TUNING CURVES to see the cell's tuning curves in response to both types
of stimuli.
Click on every stimulus to see how the plotted points define the tuning curves.
1.3 Explain - Custom activity
In general, the firing rate of any individual simple cell in V1 doesn't provide enough information to let the visual system determine the orientation of a stimulus. To see why, select a firing rate. You'll see that several different stimuli can evoke that response from this typical simple cell.
1.4 Explain - Custom activity
The responses of multiple simple cells make a pattern that can function as a population code,
giving the visual system the information it needs to determine the orientation of a stimulus. Click a button for a pair of response rates for
Simple Cells A and B. In the graph, you'll see plotted points corresponding to the orientations of stimuli that would produce the selected
response rate for each cell.
Above the graph, you'll see bars with those orientations. Can you figure out the actual orientation of the
stimulus that produced this pair of response rates?
1.5 Explain
How Does the Visual System Use the Responses of Multiple Simple Cells in V1 to Determine the Orientation of Visual Stimuli?
In this graph, the horizontal dashed line shows that three different stimuli could evoke a response of 40 spikes/sec above baseline from this cell:
● A high-contrast bar oriented at 67°.
● A low-contrast bar oriented at 90°.
● A high-contrast bar oriented at 111°.
Thus, it would be impossible for the visual system to "know" the orientation of the bar based just on a 40 spikes/sec response by this single cell. However, any relatively small area on the retina contains the receptive fields of a population of many simple cells, covering the full range of preferred orientations. Figure 2, which shows the orientation tuning curves of two simple cells (A and B) with receptive fields at the same location on the retina, indicates how the visual system uses this to solve the problem of unambiguously determining orientation.
Consider the responses of cells A and B to low- and high-contrast bars oriented at 75° or 90°, as shown in the following table:
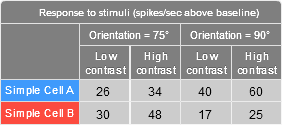
Thus, for a 90° bar the response of cell A is greater than the response of cell B, regardless of contrast. But for a 75° bar, the pattern is reversed: the response of cell B is greater than the response of cell A, regardless of contrast.
This type of patterning of the relative responses of neurons with different orientation tuning curves is called a population code, because the response patterns of a population of differently tuned neurons function as a code that lets the visual system compute the orientation of a bar of light.
1.6 Test - single choice
Select your answer to the question below. Then click SUBMIT.
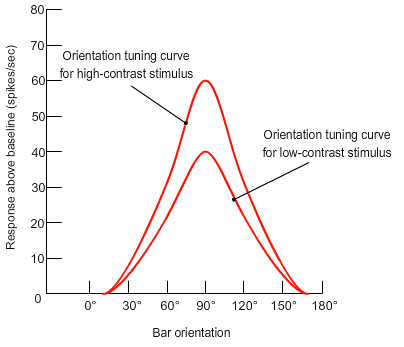
Based on this graph, and assuming that only high- and low-contrast stimuli are used, how many different stimuli could produce firing rates of 20, 30, 40, or 50 spikes/sec above baseline from this simple cell?
The correct answer is D.
Click EXPLAIN if you want to review this topic.
1.7 Test - single choice
Select your answer to the question below. Then click SUBMIT.
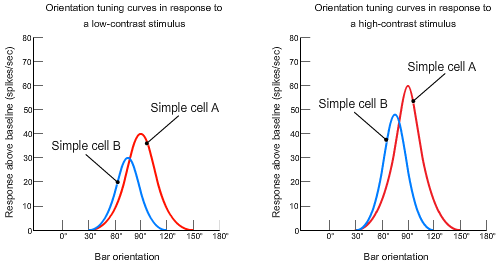
Which of the following statements matches the tuning curves in these graphs?
Click EXPLAIN if you want to review this topic.
1.8 Test - single choice
Select your answer to the question below. Then click SUBMIT.
How can the activity of a number of cells in response to a stimulus provide clear information about the orientation of the stimulus?
Click EXPLAIN if you want to review this topic.
1.9 Activity completed
Orientation Tuning of Simple Cells in V1, and Population Coding.