Chapter 5. Spectral Power Distribution
5.1 Title slide
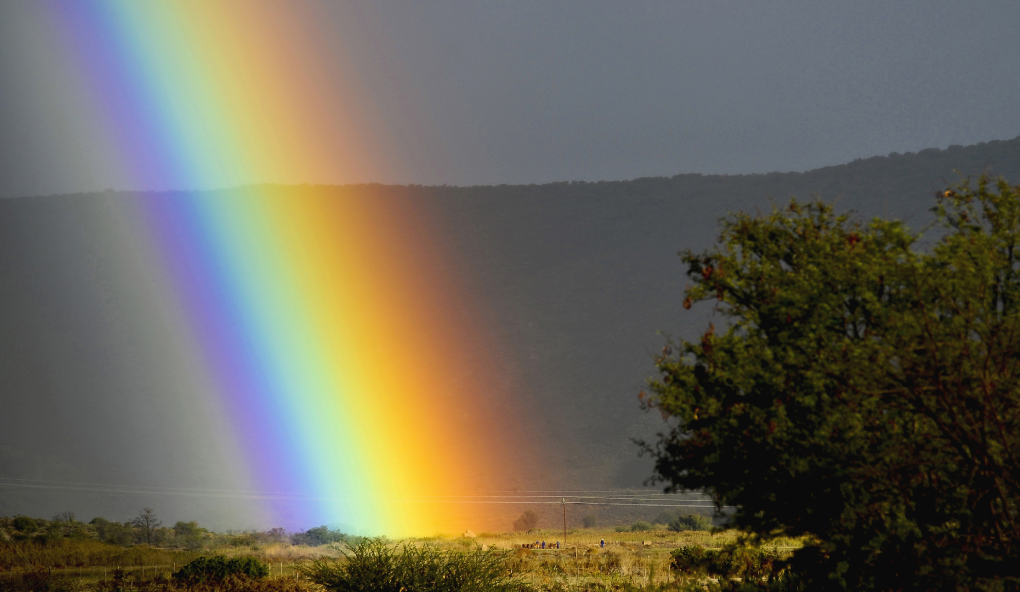
Spectral Power Distribution
See the spectral power distributions (SPDs) of different colored lights, and change the shape of SPDs to see how that affects the color of light.
CLICK ANYWHERE TO BEGIN
Photo: Jacques Marais/Getty Images.
What Is the Spectral Power Distribution of Light?
The SPD of an idealized white light would be a horizontal line: a light in which all wavelengths across the visible spectrum have exactly equal power. We perceive white light as more or less colorless. The SPD of sunlight is quite close to that of an idealized white light. In contrast, the SPD of light from an incandescent bulb is more intense toward the yellow and red end of the spectrum, while the SPD of light from a fluorescent bulb has "spikes" at short and medium wavelengths that make fluorescent light somewhat more bluish than sunlight.
5.2 Explain - dnd
Drag the nodes on the spectral power distribution curves up or down to change the relative intensities
of the component wavelengths. Observe how this changes the appearance of the lights.
5.3 Explain
What Is the Spectral Power Distribution of Light?
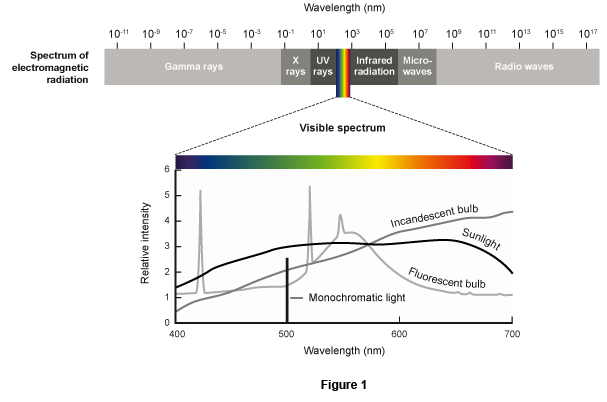
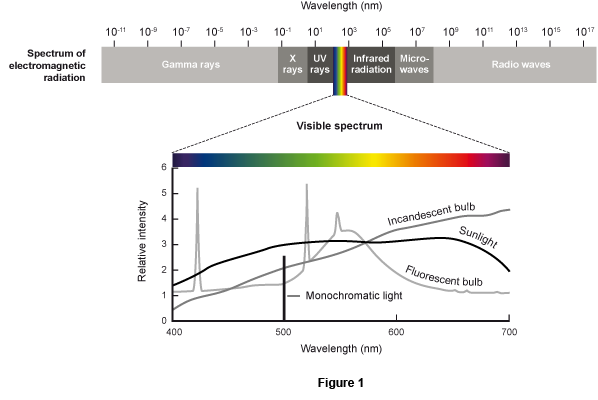
The visible part of the spectrum ranges in wavelength from about 400 to about 700 nm. For any light, we can construct a graph that depicts the light's spectral power distribution (SPD)—the intensity (power) of the light at each wavelength in the visible spectrum. The SPD is a crucial determinant of the perceived color of the light. Most light sources emit heterochromatic light, consisting of a wide range of different wavelengths. Figure 1 compares the SPDs of three heterochromatic lights: sunlight, light from an incandescent bulb, and light from a fluorescent bulb. All three of these light sources emit what could be called white light, heterochromatic light that (1) contains wavelengths from across the entire visible spectrum and (2) has no really dominant wavelengths.
The SPD of an idealized white light would be a horizontal line: a light in which all wavelengths across the visible spectrum have exactly equal power. We perceive white light as more or less colorless. The SPD of sunlight is quite close to that of an idealized white light. In contrast, the SPD of light from an incandescent bulb is more intense toward the yellow and red end of the spectrum, while the SPD of light from a fluorescent bulb has "spikes" at short and medium wavelengths that make fluorescent light somewhat more bluish than sunlight.
5.4 Test - single choice
Select your answer to the question below. Then click SUBMIT.
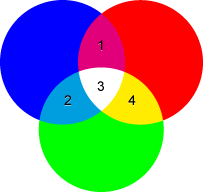
A reddish light, a bluish light, and a greenish light overlap as shown above. The spectral power distribution (SPD) of the light coming from each numbered area is the sum of the SPDs of the overlapping lights. Which numbered area has an SPD most dominated by longer wavelengths and which numbered area is dominated by shorter wavelengths?
The correct answer is C.
Click EXPLAIN if you want to review this topic.
5.5 Test - single choice
Select your answer to the question below. Then click SUBMIT.
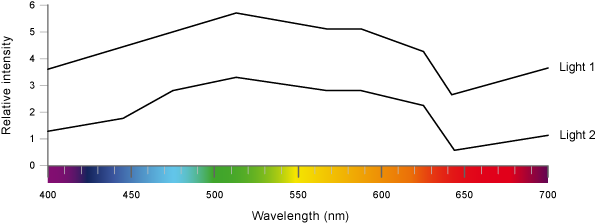
The graph above shows the spectral power distributions of two lights.
How are they likely to be perceived?
The correct answer is D.
Click EXPLAIN if you want to review this topic.
5.6 Test - dnd
Drag the correct light into the boxes for each question below. Then click SUBMIT.
The graph below shows the spectral power distributions of three lights.
How are they likely to be perceived?
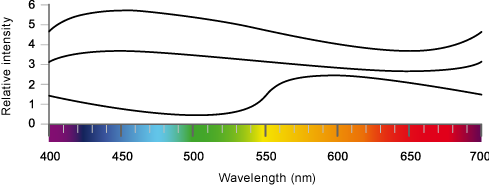
Light 1
Light 2
Light 3
5.7 Activity completed
Spectral Power Distribution.