Chapter 8. Shifting Spatial Attention
8.1 Title slide

Shifting Spatial Attention
Participate in an experiment aimed at assessing how long it takes to shift your attention.
CLICK ANYWHERE TO BEGIN
[Photo: © Jetta Productions, Inc./Spaces Images/Corbis.]
How Does the Locus of Attention Affect the Time Needed to Detect Visual Stimuli?
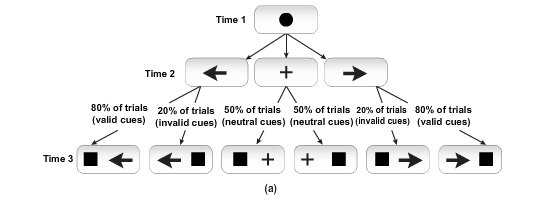
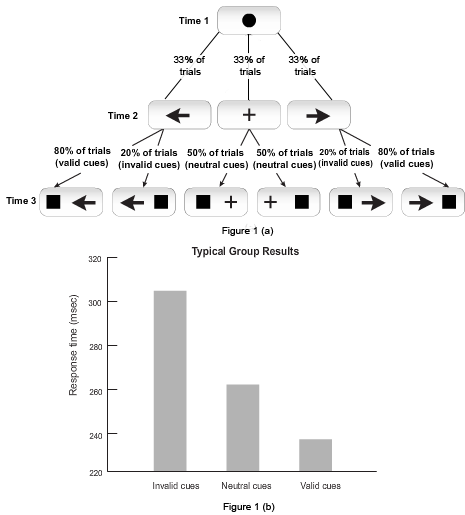
In a typical experiment (Posner et al., 1978), the participant was instructed to fixate on a point at the center of a visual display (Time 1 in Figure 1a). One of three cues then appeared in the display for one second (Time 2): a left- or right-pointing arrow indicated that the participant should direct her attention to the corresponding side of the fixation point, because she'd been told that a target was likely to appear in that location; a plus sign was a neutral cue, indicating that the target was equally likely to appear in either location. Regardless of where she directed her attention, the participant was required to keep her gaze on the fixation point. The target then appeared (Time 3), and the participant had to press a button as soon as she saw it.
When the cue indicated that the participant should direct her attention to the left or the right, the target appeared on that side in 80% of the trials (these were called valid cues) and on the other side in 20% of the trials (invalid cues); when the cue was neutral, the target appeared equally often on either side.
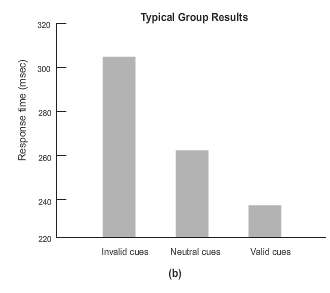
Figure 1b shows that the time required to press the button—the response time—was significantly faster when the target followed a valid cue than when it followed an invalid cue, with the response time to targets following neutral cues somewhere in between. This indicates that detecting the target is significantly faster when it appears in an attended location than when it appears in an unattended location. It's as if an "attentional spotlight" is directed to the cued location, and this speeds perception.
8.2 Activity
In this demonstration, you’ll be a participant in an experiment modeled after one that was conducted in 1978.
The original experiment measured differences in response time to stimuli in attended versus unattended locations. The results
led the researchers to conclude that people can move their visual attention around a scene without moving their eyes and that people
respond faster to stimuli that appear in an attended location. You’ll see whether your own results support those conclusions.
Completing the experiment will take you about 10 minutes.
In each trial of the experiment:
1. A cue will appear at the center of the display. The cue will be an arrow or a plus sign.
2. A short time later, a target will appear to the left or the right of the cue. The target will be a black square.
3. Press the spacebar as soon as you see the target in your peripheral vision, without moving your eyes from the cue.
On trials where the cue is an arrow (like the one below), you can expect the target to appear on the side where the arrow is pointing. (It’s much more likely, but not certain, to appear on that side of the arrow than on the other side.)
On trials where the cue is a plus sign (like the one below), you can’t predict where the target will appear—it’s as likely to appear on the left of the cue as on the right.
On all trials, regardless of where the target appears, you must press the spacebar as soon as you see the target, because the computer will be measuring your response time—the time from the moment when the target appears to the moment when you press the spacebar.
8.3 Activity
8.4 Activity
Now it’s time to begin the actual experiment—120 trials like the practice trials.
It should take you 5–10 minutes to complete all 120 trials.
Be sure to complete all the trials—if you don’t, you won’t be able to see your results.
The computer will be measuring your response time in each trial, so be sure to press the spacebar as soon as you see the square target.
8.5 Activity
8.6 Activity
The graphs below show the response times on trials where the cue (an arrow or a plus sign) was valid, invalid, or neutral:
• 80% of the arrow cues were valid (the arrow pointed to the side where the target appeared).
• 20% of the arrow cues were invalid (the arrow pointed away from the side where the target appeared).
• The plus sign cues were neutral (the target appeared to the left of the cue 50% of the time and to the right 50% of the time).
The graph on the left is based on the results from the original 1978 experiment and reflects the typical group results from this type of experiment. The graph on the right shows your median response time for each type of cue (valid, invalid, or neutral). In both graphs, a lower response time means a faster response.
Your results cannot be displayed because you didn't complete all 120 trials.
If you want to complete all the trials and see your results, click FINISH.
8.7 Explain
How Does the Locus of Attention Affect the Time Needed to Detect Visual Stimuli?
In a typical experiment (Posner et al., 1978), the participant was instructed to fixate on a point at the center of a visual display (Time 1 in Figure 1a). One of three cues then appeared in the display for one second (Time 2): a left- or right-pointing arrow indicated that the participant should direct her attention to the corresponding side of the fixation point, because she'd been told that a target was likely to appear in that location; a plus sign was a neutral cue, indicating that the target was equally likely to appear in either location. Regardless of where she directed her attention, the participant was required to keep her gaze on the fixation point. The target then appeared (Time 3), and the participant had to press a button as soon as she saw it.
When the cue indicated that the participant should direct her attention to the left or the right, the target appeared on that side in 80% of the trials (these were called valid cues) and on the other side in 20% of the trials (invalid cues); when the cue was neutral, the target appeared equally often on either side.
Figure 1b shows that the time required to press the button—the response time—was significantly faster when the target followed a valid cue than when it followed an invalid cue, with the response time to targets following neutral cues somewhere in between. This indicates that detecting the target is significantly faster when it appears in an attended location than when it appears in an unattended location. It's as if an "attentional spotlight" is directed to the cued location, and this speeds perception.
8.8 Test - single choice
Select your answer to the question below. Then click SUBMIT.

This graph shows a typical pattern of results from an attentional cuing experiment like the one in this demonstration. What do these results imply about response times and the locus of attention?
The correct answer is D.
Click EXPLAIN if you want to review this topic.
8.9 Test - single choice
Select your answer to the question below. Then click SUBMIT.
In an attentional cuing experiment like the one in this demonstration, what do you think the results would be if the arrow cues were as neutral as the plus sign—that is, if the target appeared equally often on either side of the arrow regardless of which way the arrow was pointing—and if participants were told beforehand that this would be the case?
The correct answer is С.
Click EXPLAIN if you want to review this topic.
8.10 Test - single choice
Select your answer to the question below. Then click SUBMIT.
In attentional cuing experiments like the one in this demonstration, the cue is presented about 1 second before the target appears. How do you think the results would be affected if the cue and the target were always presented simultaneously?
The correct answer is C.
Click EXPLAIN if you want to review this topic.
8.11 Test - single choice
Select your answer to the question below. Then click SUBMIT.
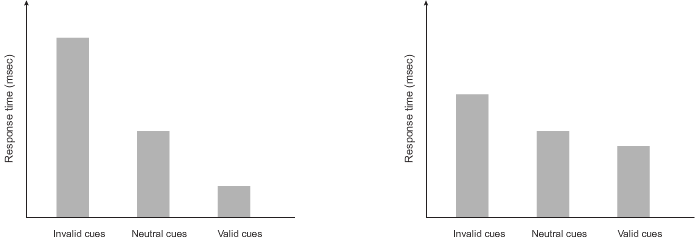
The graph on the left shows a typical pattern of results from an attentional cuing experiment like the one in this demonstration. What would be the most likely explanation for a pattern like the one in the graph at the right?
8.12 Activity completed
Shifting Spatial Attention.