do the math
Estimating LD50 Values and Safe Exposures
Using our knowledge of how scientists conduct LD50 studies, we can consider an example. Let’s imagine that you are a scientist charged with determining the safe levels for mammals of a pesticide in the environment. Using lab rats, you feed them a diet that contains different amounts of the pesticide, ranging from 0 to 4 mg of pesticide per kg of the rat’s mass. After feeding them these diets for 4 days, you count how many rats are still alive. When you plot the data, you obtain the graph below.
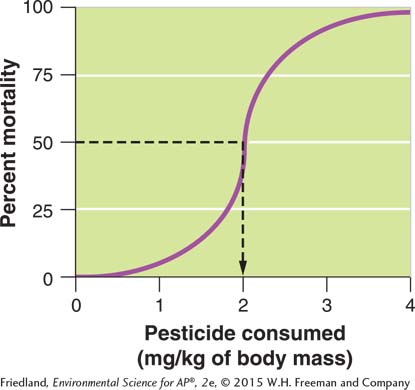
What is the LD50 value for lab rats? To determine this, we can draw a horizontal line at the point of 50 percent mortality on the y axis. Where this line intersects the purple line, we can draw another line straight down to the x axis. This second line crosses the x axis at 2 mg/kg of mass.
Based on this LD50 study, what amount of pesticide would be considered safe for mammals to ingest? Recall that we can calculate this number by taking the LD50 value and dividing it by 10. Thus the safe amount of pesticide for a rat is:

Your Turn Using the same LD50 study, what amount of pesticide would be considered safe for a human to ingest?