module 18 The Abundance and Distribution of Populations
Complexity in the natural world ranges from a single individual to all of the biotic and abiotic components of Earth. In this module, we will begin by broadly examining the different levels of complexity in nature and then narrow our focus to the population level. We will consider the characteristics of populations and then discuss factors that determine how populations increase and decrease over time.
Learning Objectives
After reading this module you should be able to
explain how nature exists at several levels of complexity.
discuss the characteristics of populations.
contrast the effects of density-
dependent and density- independent factors on population growth.
Nature exists at several levels of complexity
As FIGURE 18.1 shows, the environment around us exists at a series of increasingly complex levels: individuals, populations, communities, ecosystems, and the biosphere. The simplest level is the individual—
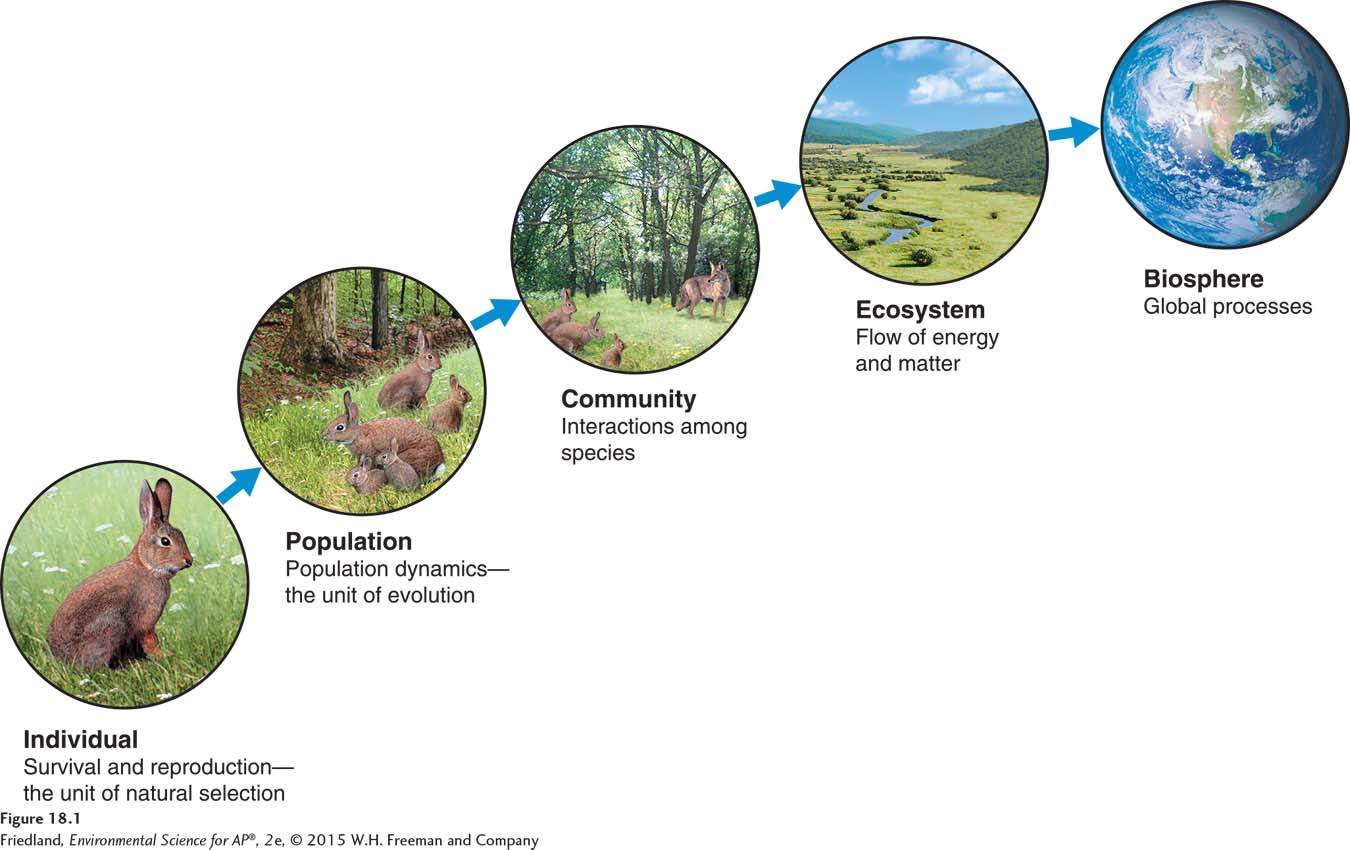
Population The individuals that belong to the same species and live in a given area at a particular time.
The second level of complexity is a population. A population is composed of all individuals that belong to the same species and live in a given area at a particular time. Evolution occurs at the level of the population. Scientists who study populations are also interested in the factors that cause the number of individuals to increase or decrease. As we saw in Chapter 1, the boundaries of a population are rarely clear and may be set arbitrarily by scientists. For example, depending on what we want to learn, we might study the entire population of white-
Community All of the populations of organisms within a given area.
The third level of complexity is the community. A community incorporates all of the populations of organisms within a given area. Like those of a population, the boundaries of a community may be defined by the state or federal agency responsible for managing it. Scientists who study communities are generally interested in how species interact with one another. In Chapter 4, we saw that terrestrial communities can be grouped into biomes that contain plants with similar growth forms. However, the actual composition of tree species varies from community to community. While the temperate seasonal forests of the eastern United States and Europe experience similar patterns of temperature and precipitation, they contain different tree species.
Communities exist within an ecosystem, which consists of all of the biotic and abiotic components in a particular location. Ecosystem ecologists study flows of energy and matter, such as the cycling of nutrients through the system.
The largest and most complex system environmental scientists study is the biosphere, which incorporates all of Earth’s ecosystems. Scientists who study the biosphere are interested in the movement of air, water, and heat around the globe.
Populations have distinctive characteristics
Population ecology The study of factors that cause populations to increase or decrease.
When we study nature at the level of the population, one of the first things that becomes apparent is that populations are dynamic—
There are many circumstances in which scientists find it useful to identify the factors that influence population size over time. For example, in the case of endangered species such as the California condor (Gymnogyps californianus), knowing the factors that affect its population size has helped us to implement measures that improve its survival and reproduction. Similarly, knowing the factors that influence the population size of a pest species can help us control it. For instance, population ecologists are currently studying the emerald ash borer (Agrilus planipennis), an insect from Asia that was accidentally introduced to the American Midwest and is causing the widespread death of ash trees. Once we understand the population ecology of this destructive insect, we can begin to explore and develop strategies to control or eradicate it.
To understand how populations change over time, we must first examine the basic characteristics of populations. These characteristics are size, density, distribution, sex ratio, and age structure.
Population Size
Population size (N) The total number of individuals within a defined area at a given time.
Population size (N) is the total number of individuals within a defined area at a given time. For example, the California condor once ranged throughout California and the southwestern United States. Over the past 2 centuries, however, a combination of poaching, poisoning, and accidents (such as flying into electric power lines) greatly reduced the population’s size. By 1987, only 22 birds remained in the wild. Scientists realized that the species was nearing extinction and decided to capture all the wild birds and start a captive breeding program in zoos. As a result of these captive breeding programs and other conservation efforts, the condor population size had increased to more than 437 birds by 2014.
Population Density
Population density The number of individuals per unit area at a given time.
Population density is the number of individuals per unit area (or volume, in the case of aquatic organisms) at a given time. Knowing a population’s density, in addition to its size, can help scientists estimate whether a species is rare or abundant. For example, the density of coyotes (Canis latrans) in some parts of Texas might be only 1 per square kilometer, but in other parts of the state it might be as high as 12 per square kilometer. Scientists also study population density to determine whether a population in a particular location is so dense that it might outstrip its food supply.
Population density can be a particularly useful measure for wildlife managers who must set hunting or fishing limits on a species. For example, managers may divide the entire population of an animal species that is hunted or fished into management zones. Management zones may be designated political areas, such as counties, or areas with natural boundaries, such as the major water bodies in a state. Wildlife managers might offer more hunting or fishing permits for zones with a high-
Population Distribution
Population distribution A description of how individuals are distributed with respect to one another.
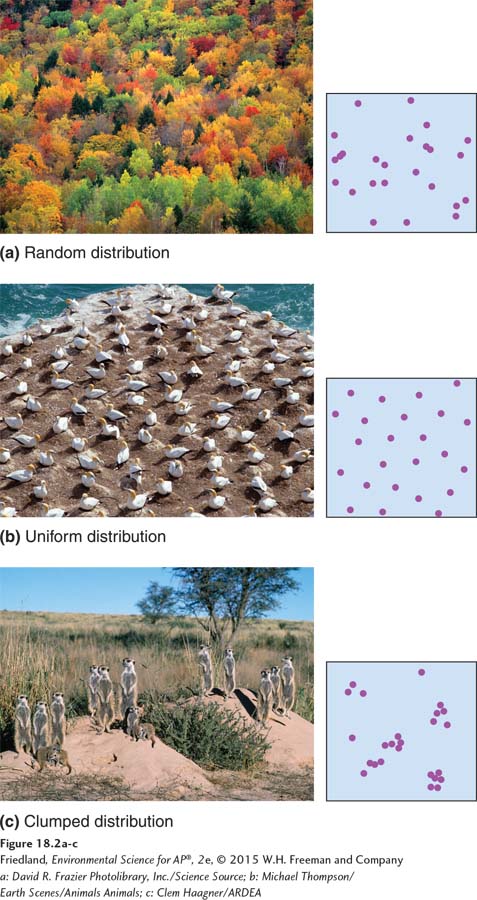
In addition to population size and density, population ecologists are interested in how a population occupies space. Population distribution is a description of how individuals are distributed with respect to one another. FIGURE 18.2 shows three types of population distributions. In some populations, such as a population of trees in a natural forest, the distribution of individuals is random (FIGURE 18.2a). In other words, there is no pattern to the locations where the individual trees grow.
In other populations, such as a population of trees in a plantation, the distribution of individuals is uniform, or evenly spaced (FIGURE 18.2b). Uniform distributions are common among territorial animals, such as nesting birds that defend areas of similar sizes around their nests. Uniform distributions are also observed among plants that produce toxic chemicals to prevent other plants of the same species from growing close to them.
In still other populations, the distribution of individuals is clumped (FIGURE 18.2c). Clumped distributions, which are common among schooling fish, flocking birds, and herding mammals, are often observed when living in large groups provides enhanced feeding opportunities or protection from predators.
Population Sex Ratio
Sex ratio The ratio of males to females in a population.
The sex ratio of a population is the ratio of males to females. In most sexually reproducing species, the sex ratio is usually close to 50:50, although sex ratios can be far from equal in some species. In fig wasps, for example, there may be as many as 20 females for every male. Because the number of offspring produced is primarily a function of how many females there are in the population, knowing a population’s sex ratio helps scientists estimate the number of offspring a population will produce in the next generation.
Population Age Structure
Age structure A description of how many individuals fit into particular age categories in a population.
Many populations are composed of individuals of varying ages. A population’s age structure describes how many individuals fit into particular age categories. Knowing a population’s age structure helps ecologists predict how rapidly a population can grow. For instance, a population with a large proportion of old individuals no longer capable of reproducing, or with a large proportion of individuals too young to reproduce, will produce far fewer offspring than a population that has a large proportion of individuals of reproductive age.
Population size is affected by density-dependent and density-independent factors
Factors that influence population size can be classified as density dependent or density independent. We will look at each type in turn.
Density-
In 1932, Russian biologist Georgii Gause conducted a set of experiments that demonstrated that food supply can control population growth. Gause monitored population growth in two species of Paramecium (a type of single-
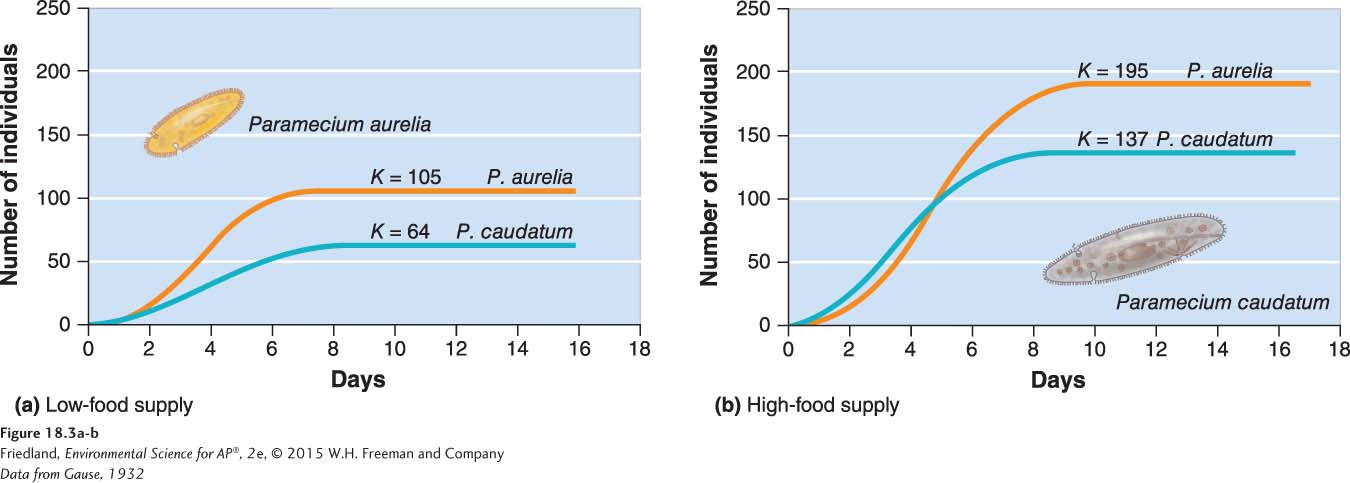
Gause suspected that Paramecium population growth was limited by food supply. To test this hypothesis, he conducted a second experiment in which he doubled the amount of food he added to the test tubes. Again, both species of Paramecium experienced rapid population growth early in the experiment, and the rate of growth, again, slowed over time. However, as FIGURE 18.3b shows, their maximum population sizes were approximately double those observed in the first experiment.
Limiting resource A resource that a population cannot live without and that occurs in quantities lower than the population would require to increase in size.
Gause’s results confirmed that food is a limiting resource for Paramecium. A limiting resource is a resource that a population cannot live without and that occurs in quantities lower than the population would require to increase in size. If a limiting resource decreases, so does the size of a population that depends on it. For terrestrial plant populations, water and nutrients such as nitrogen and phosphorus are common limiting resources. For animal populations, food, water, and nest sites are common limiting resources.
Density-
Factors such as food that influence an individual’s probability of survival and its amount of reproduction in a manner that depends on the size of the population are called density-
Carrying capacity (K) The limit of how many individuals in a population the environment can sustain.
In Gause’s Paramecium experiments, population growth slowed as population size increased because there was a limit to how many individuals the food supply could sustain. This limit to the number of individuals that can exist in a population is called the carrying capacity of the environment and is denoted as K. Knowing the carrying capacity for a species and its limiting resource helps us predict how many individuals an environment can sustain.
Density-
Density-
Whereas density-
Bird populations are often regulated by density-