Chapter 20 Branched Tutorial: Restriction Mapping
Problem Statement
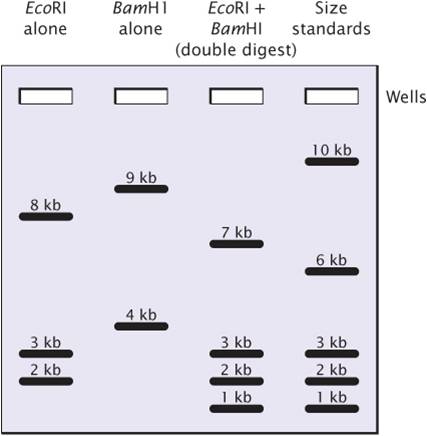
Restriction sites can be mapped by comparing DNA fragments produced by digestion with restriction enzymes used alone and in various combinations.
The experiment began with one sample of a linear 13,000-bp (13-kb) DNA fragment being cut with the restriction enzyme EcoRI; a second sample of the same DNA was cut with BamHI; and a third sample was cut with both EcoRI and BamHI together.
The figure at the right represents the separation of DNA fragments by gel electrophoresis.
Question
Provide the correct restriction map of the linear DNA fragment based on the results shown on the gel image by choosing the correct enzyme names and fragment sizes from the associated dropdown menus.
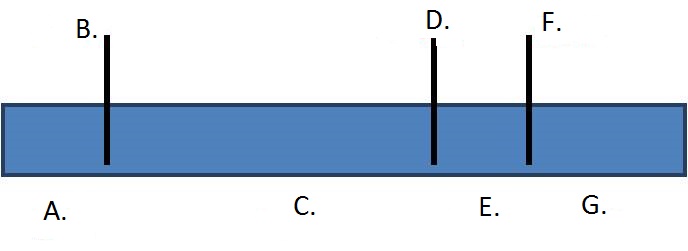
| A. | B. | C. | D. | E. | F. | G. |
Problem Strategy
Question
Determine the best approach to solve this problem by ordering the following steps:
1. Examine the results shown on the gel and compare the single digests with the double digest.
2. Identify the question that is being asked and focus on key pieces of information.
3. Examine the results shown on the gel and analyze each lane independently by constructing a restriction map for each single digest.
4. Construct a restriction map based on the double digest.
1. Which of the following is the correct order of steps that should be used to solve this problem?
| A. |
| B. |
| C. |
| D. |
Instant TA
Begin with the basic information and individual analyses and then build upon this information to solve the problem. The best approach is to analyze each single digest independently and then construct the restriction map of the double digest.
Step 1: Understanding the problem
Question
1. What type of fragment is being digested?
| A. |
| B. |
Instant TA
DNA molecules can be linear or circular. Read the question carefully to learn what type of fragment is being digested.
Step 2: Analyzing the Gel
Question
1. How many fragments result from the single digest with EcoRI?
| A. |
| B. |
| C. |
| D. |
Instant TA
Focus on only the lane that is labeled “EcoRI alone” in order to determine your answer. A fragment is displayed as a band or single line on the gel.
Step 3: Understanding the Data
Question
1. Are there any common fragment sizes between the double digest and the EcoRI digest?
| A. |
| B. |
Instant TA
Focus on the lanes that are labeled “EcoRI alone” and “Double Digest” in order to determine your answer. A fragment is displayed as a band or single line on the gel.
Step 4: Solving the Problem
Question
1. Draw a restriction map based on the third lane of the gel. Choose from the dropdown menus below to correctly label each restriction enzyme recognition site and fragment size.
| A. | B. | C. | D. | E. | F. | G. |
Instant TA
Remember that there are EcoRI fragments which are not cut by BamHI. These fragment sizes should not contain a BamHI restriction site on your map. Begin your mapping by identifying the largest EcoRI generated fragment—remember, this fragment contains a BamHI site. Be sure that you are locating the 7 kb and 1 kb fragments generated by a BamHI enzyme next to each other on the map. Keep in mind that the total size of the fragments needs to be equal to the size of the initial DNA fragment before digestion.