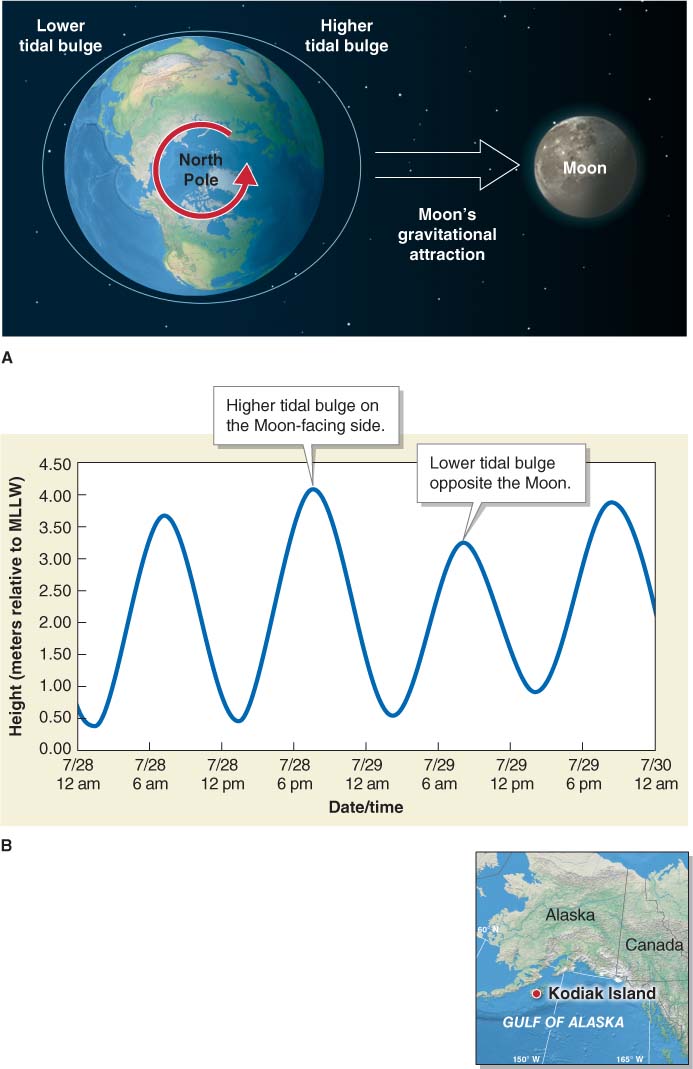
Figure 19.2
Ocean tides. (A) Earth’s two tidal bulges are greatly exaggerated here to be visible. The tidal bulge nearest the Moon is the larger of the two. Any location on Earth will pass through a tidal bulge approximately every 12 hours. (B) This tide graph shows the twic