Figure 5.22
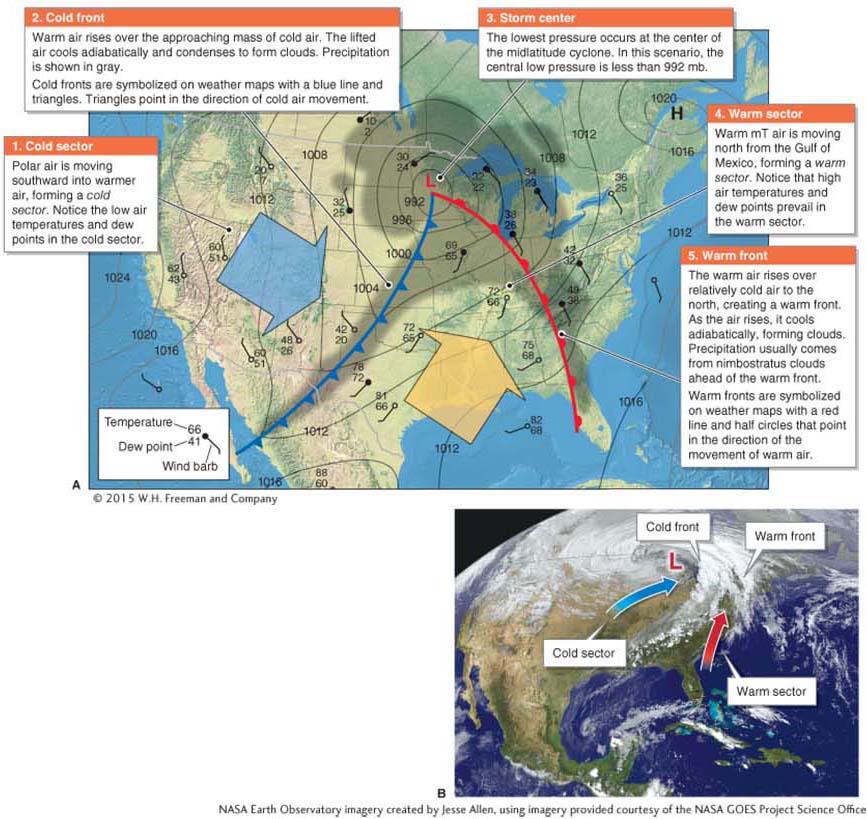
GEO-GRAPHIC: Midlatitude cyclone. (A) This weather map of North America shows how a typical warm front and cold front integrate to form a midlatitude cyclone. Pressure decreases toward the center of the system, as shown by the isobars; the lowest pressure, at the center, is labeled L for “low.” Notice the changing air temperature and dew point ahead of and behind both fronts. After a warm front moves through, the air temperature and dew point rise. After a cold front moves through, the air temperature and dew point fall. The gray area shows cloudiness and precipitation. (B) This October 26, 2010, satellite image shows a midlatitude cyclone spanning much of eastern North America. It is labeled with the features illustrated in part A.(B. NASA Earth Observatory imagery created by Jesse Allen, using imagery provided courtesy of the NASA GOES Project Science Office)