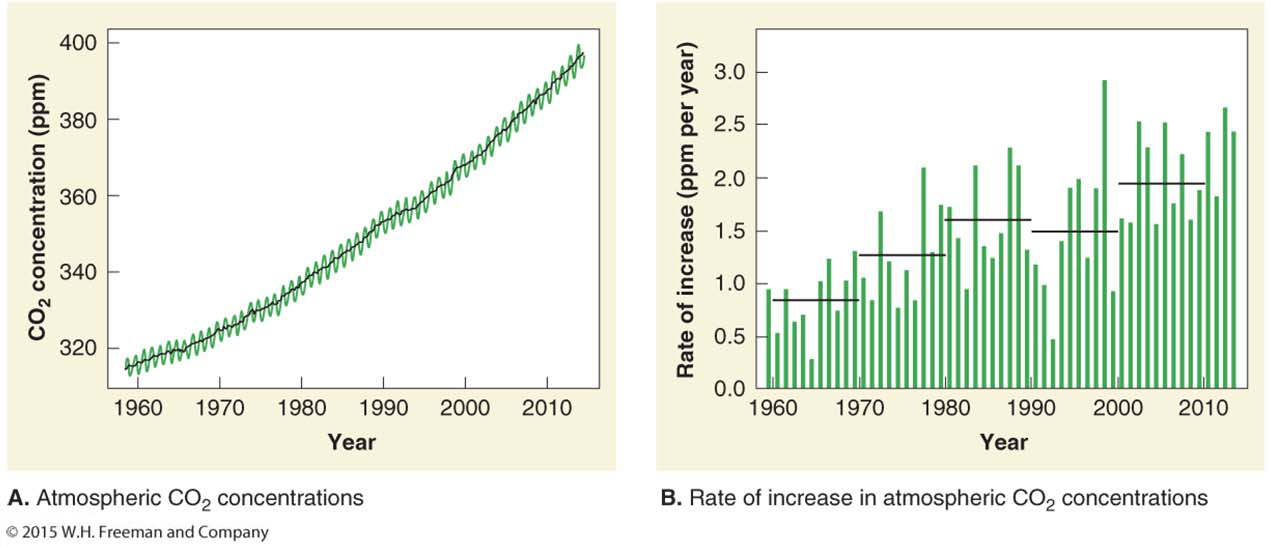
Figure 6.14
Atmospheric carbon dioxide concentrations are increasing. (A) The Keeling curve shows concentrations of CO2 in the atmosphere. The green line shows actual CO2 measurements, which fluctuate with the seasons. In summer, values drop as plants grow and pull CO2 from the atmosphere. In winter, values rise as plants lose their leaves, which decay and release stored carbon back into the atmosphere. The black line is the annual average. (B) The rate of increase of atmospheric CO2 concentrations. The black bars show the average annual rate of increase by decade. In the 1960s, CO2 rose a little less than 1 ppm per year. By 200(Data from NOAA)