9.4 Water Resources under Pressure

Assess the importance of water resources to human societies.
It is a paradox that even though 71% of Earth’s surface is covered by water, and even though water is perpetually cleaned and freshened through the hydrologic cycle (see Section 3.1), freshwater is a resource that many people lack. There is a limit to how fast water is cleaned in the hydrologic cycle. As the global human population and its economic affluence grow, water, both on the surface and in the ground, is becoming an increasingly important and scarce resource.
Water Footprints
The water footprint is the amount of water required to produce a specific item, food, or service. Consider how much water is needed to produce some common foods (Table 9.3).
|
ITEM PRODUCED |
WATER FOOTPRINT |
|
|---|---|---|
|
|
LITERS |
GALLONS |
|
1 apple |
70 |
18 |
|
1 L (0.26 gal) of coffee |
876 |
231 |
|
1 kg (2.2 lb) of wheat |
1,000 |
264 |
|
1 kg (2.2 lb) of rice |
3,400 |
898 |
|
1 kg (2.2 lb) of chicken |
3,546 |
937 |
|
1 kg (2.2 lb) of beef |
13,620 |
3,598 |
|
1 kg (2.2 lb) of chocolate |
24,000 |
6,340 |
water footprint
The amount of water required to produce a specific item, food, or service.
Question 9.8
How much water is needed to produce 1 kg (2.2 lb) of beef?
About 13,620 L (3,598 gal) of water are needed to produce 1 kg (2.2 lb) of beef.
Why does a single kilogram of beef require 13,620 liters of water to produce? The food the cow ate during its lifetime—
When foods are grown in a suitable climate, much of the water used to grow or raise them falls directly from the sky. Chocolate, for example, comes from the seeds of the cacao tree (Theobroma cacao). Plantations of cacao trees are located in tropical regions where the climate naturally meets the plant’s water needs. In contrast, some foods are grown or raised in semiarid or arid lands, such as beef in Texas. In this example, the water needed does not fall from the sky and must instead be pumped from the ground or diverted from streams.
Manufactured goods, such as computers, cars, and clothing, all take water to produce. Compared with foods, it is less easy to see why material goods require water, but many of them have substantial water footprints (Table 9.4).
|
ITEM PRODUCED |
WATER FOOTPRINT |
|
|---|---|---|
|
|
LITERS |
GALLONS |
|
1 empty 1- |
3 |
0.79 |
|
1 cotton T- |
2,700 |
713 |
|
500 sheets of binder paper |
5,000 |
1,320 |
|
1 pair of (cow) leather shoes |
7,580 |
2,002 |
|
1 car |
147,810 |
39,047 |
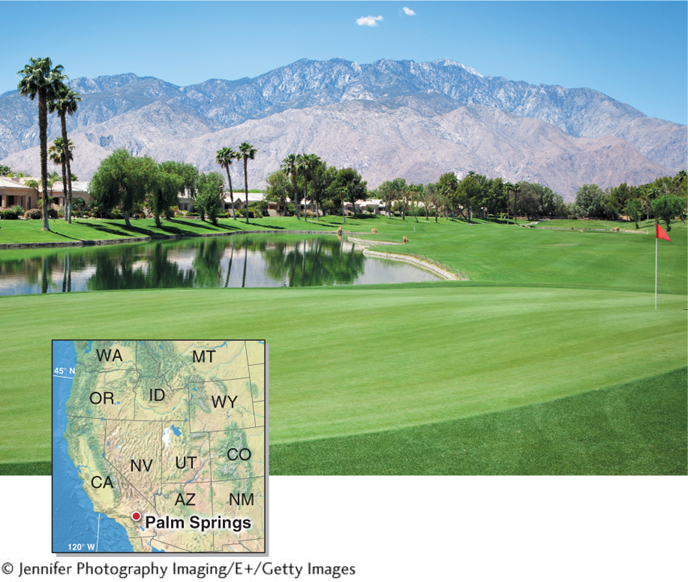
Many services require water as well. Golf courses, for example, have an inordinately large water footprint. Their close-

Out of economic necessity, and to their credit, many golf course managers are adapting to the realities of increasing water scarcity. About 1,000 golf courses in the United States are now using, at least in part, recycled or reclaimed water (wastewater from the golf facility and treated sewage water). They are also planting more drought-
The Global Reach of Virtual Water
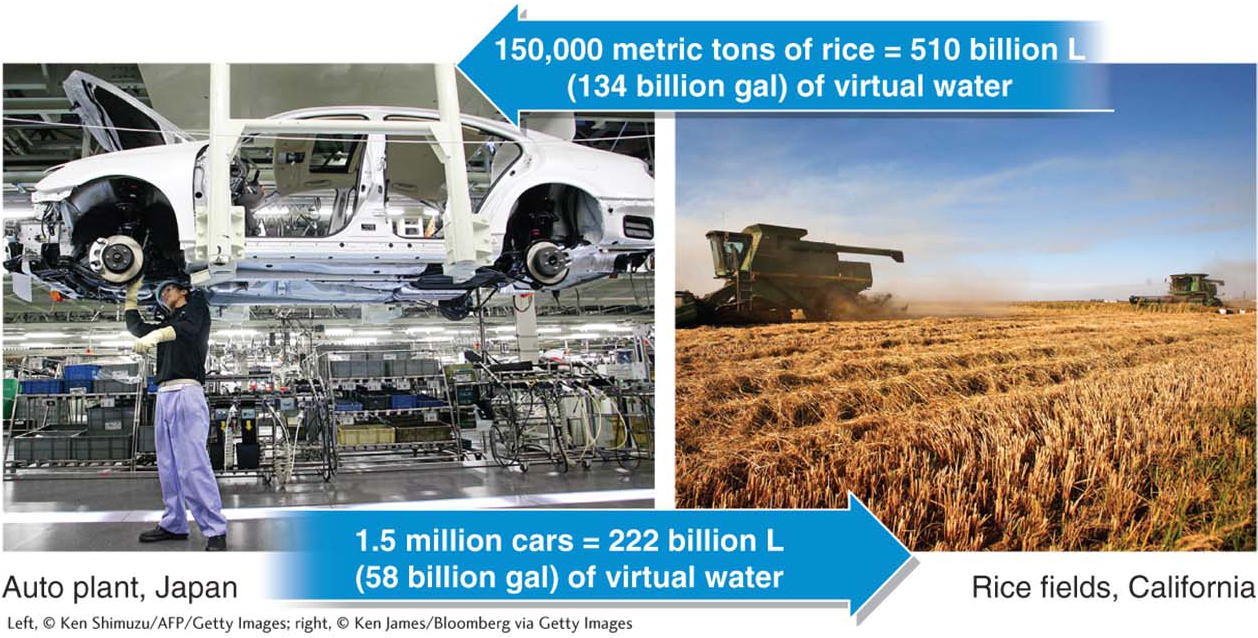
Water resources have a borderless, global dimension. Water consumption is not restricted by political borders because many of the goods people use and the foods people eat come from somewhere else, often far away. Imported foods and goods are sometimes more common than domestic products. Chinese toys, New Zealand apples, Chilean grapes and wines, California almonds, Japanese electronics and cars, and Midwestern beef all exact a water toll on their country of origin.
The unseen water required to produce a manufactured item or food is called virtual water. As these goods move around the planet, their virtual water travels with them, as shown in Figure 9.35.

virtual water
The unseen water required to produce a manufactured item or food.
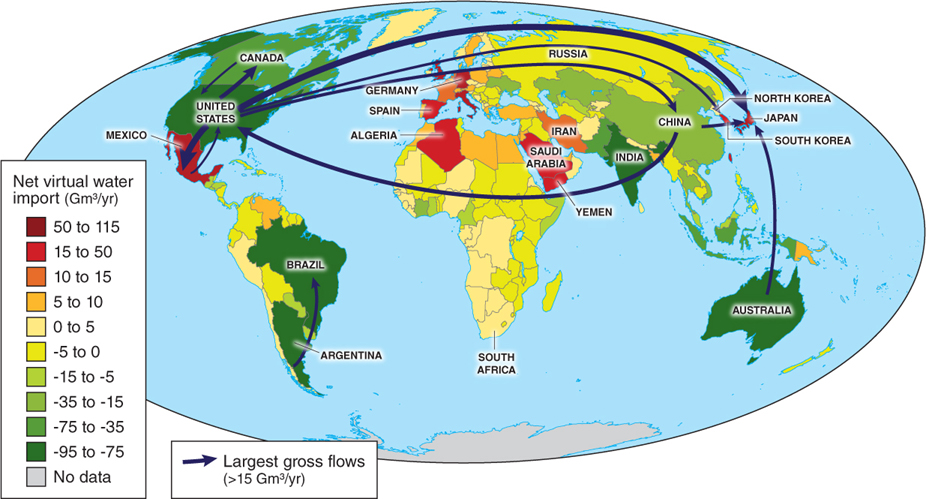
Between 1996 and 2005, the average annual global flow of virtual water was 908 trillion L (240 trillion gal). Of this, 92% was in the form of agricultural crops or products derived from crops (such as paper and cotton). Figure 9.36 shows the balance between water exports and imports for individual countries between 1996 and 2005.

Earth’s physical systems, such as soils and water, and the people in them are interconnected. Countries that receive imports have an impact on the water resources and environments of the exporting country. For example, diversions of water from the Aral Sea are used to grow cotton in the desert of Uzbekistan. These diversions are causing the Aral Sea to shrink and its wetland ecosystems to disappear, leaving behind toxic dust that has poisoned local residents. The cotton grown in Uzbekistan using the diverted water is then exported somewhere else, such as China, to manufacture goods such as jeans and T-
The Future of Water
The human population has just passed the 7 billion mark and continues to grow. This single statistic underpins all environmental issues today, but it is particularly relevant to the scarcity of water resources. Global population numbers are an important part of the story, but not the only part. Higher levels of economic development are usually associated with higher water demands, and unequal political power within a geographic region can also exacerbate water shortages for politically disadvantaged populations.
In economically developed nations, water shortages range from an inconvenience to causing serious economic and ecological harm. In developing countries, water resources are a matter of life and death. Consider these statistics from the United Nations:
Worldwide, 884 million people do not have access to safe drinking water. About 40% of those people live in sub-
Saharan Africa. Nearly 5,000 children in developing countries die each day (1.8 million per year) from waterborne diseases such as dysentery and cholera.
By some estimates, half the world’s hospital beds are filled with people who got sick from drinking contaminated water.
Economic development for poverty-
Human population growth, economic development, and climate change are three converging global forces that will make freshwater an increasingly precious natural resource. As a result, conflict over water is likely to be the catalyst for serious environmental, geopolitical, and humanitarian issues in the coming decades.