APPENDIX 5 Wind Chill and Heat-Index Charts
APPENDIX 5 Wind Chill and Heat-
The air temperature that a person feels and the measured temperature are not always the same. Wind makes air feel colder because it removes heat from exposed skin. Humidity makes air feel warmer because it reduces evaporative cooling from exposed skin. Wind chill and heat-
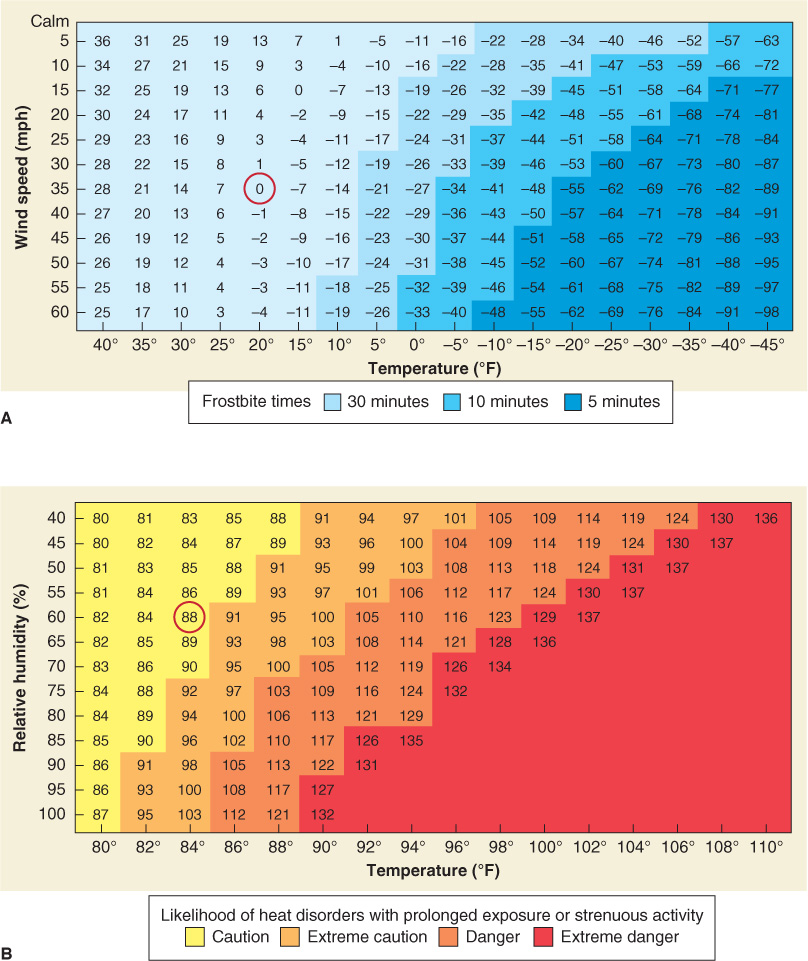
Wind chill and heat-index charts. (A) The wind chill temperature at a particular measured air temperature and wind speed can be determined by using this wind chill chart. A measured air temperature of 20°F (horizontal axis) and a 35 mph wind (vertical axis), for example, create a wind chill temperature of 0°F (circled in red). The chart also shows frostbite times for exposed skin. In the purple region, frostbite occurs within 5 minutes of exposure. (B) The heat-index temperature at a particular measured air temperature and relative humidity can be determined by using this heat-index chart. A measured air temperature of 84°F (horizontal axis) and a relative humidity of 60% (vertical axis) create a heat-index temperature of 88°F (circled in red).
Page A-9