14.4 Unstable Crust: Seismic Waves
Describe the types of seismic waves produced by earthquakes, how earthquakes are ranked, and what can be done to reduce our vulnerability to earthquakes.
No two earthquakes are exactly alike. After people have been in an earthquake, they may describe “rolling” or “up-

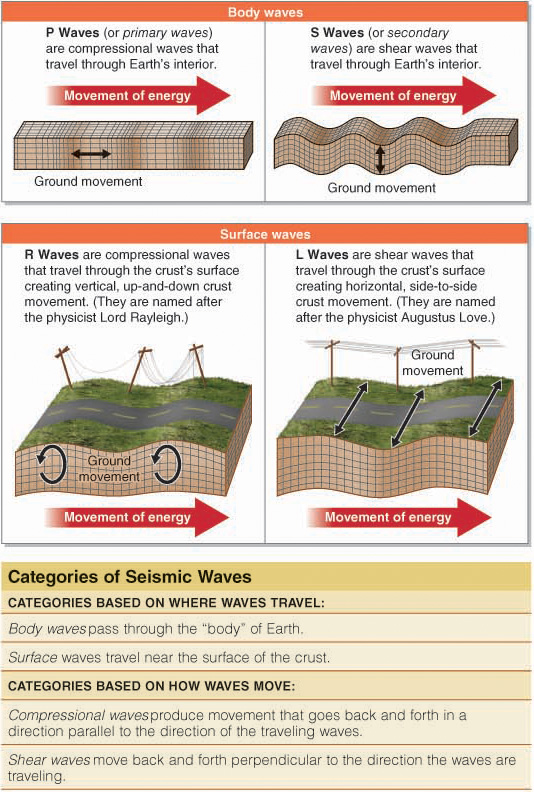
P waves are fast-
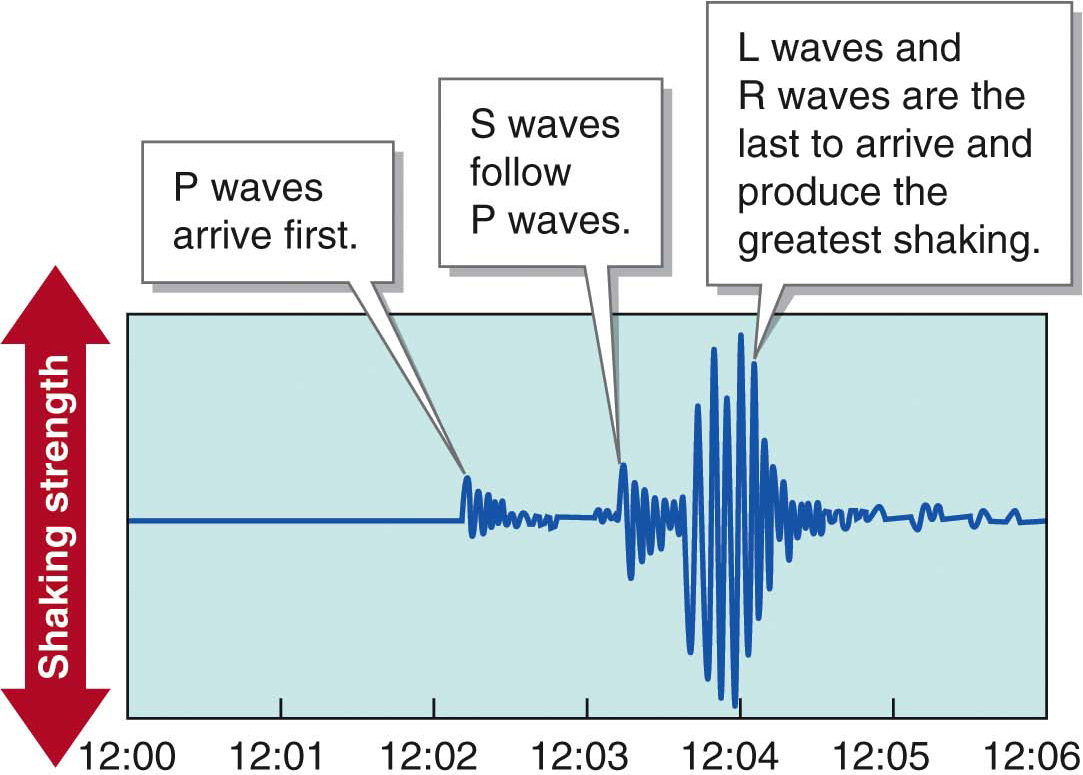
The seismic waves detected at the earthquake focus always reach the epicenter first and, normally, shake the ground there the most. Ground shaking usually decreases with distance from the epicenter because the crust absorbs seismic wave energy.
Detecting Earthquakes
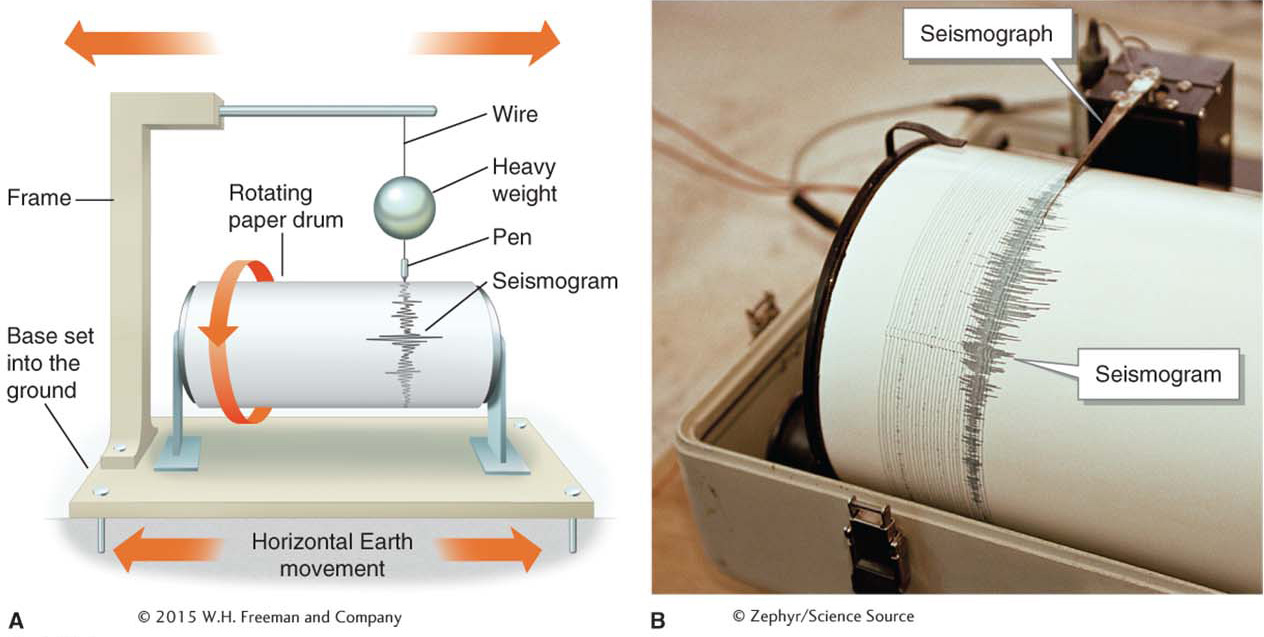
seismograph
(or seismometer) An instrument used to detect, measure, and record ground shaking.
The instruments used to detect, measure, and record ground shaking are called seismographs (or seismometers). Before the digital era, seismographs consisted of a swinging pendulum that recorded ground shaking (Figure 14.26A). Modern electronic seismographs generate an electrical signal to measure ground shaking and are far more sensitive than traditional pendulum seismographs (Figure 14.26B).
Ranking of Earthquake Strength
The amount of ground shaking caused by an earthquake depends on the earthquake’s magnitude, the distance from its focus, and the composition of the ground being shaken. Two measures are used to characterize an earthquake’s strength: (1) intensity and (2) magnitude.
Earthquake Intensity
modified Mercalli intensity (MMI) scale
An earthquake ranking system based on the damage done to structures.
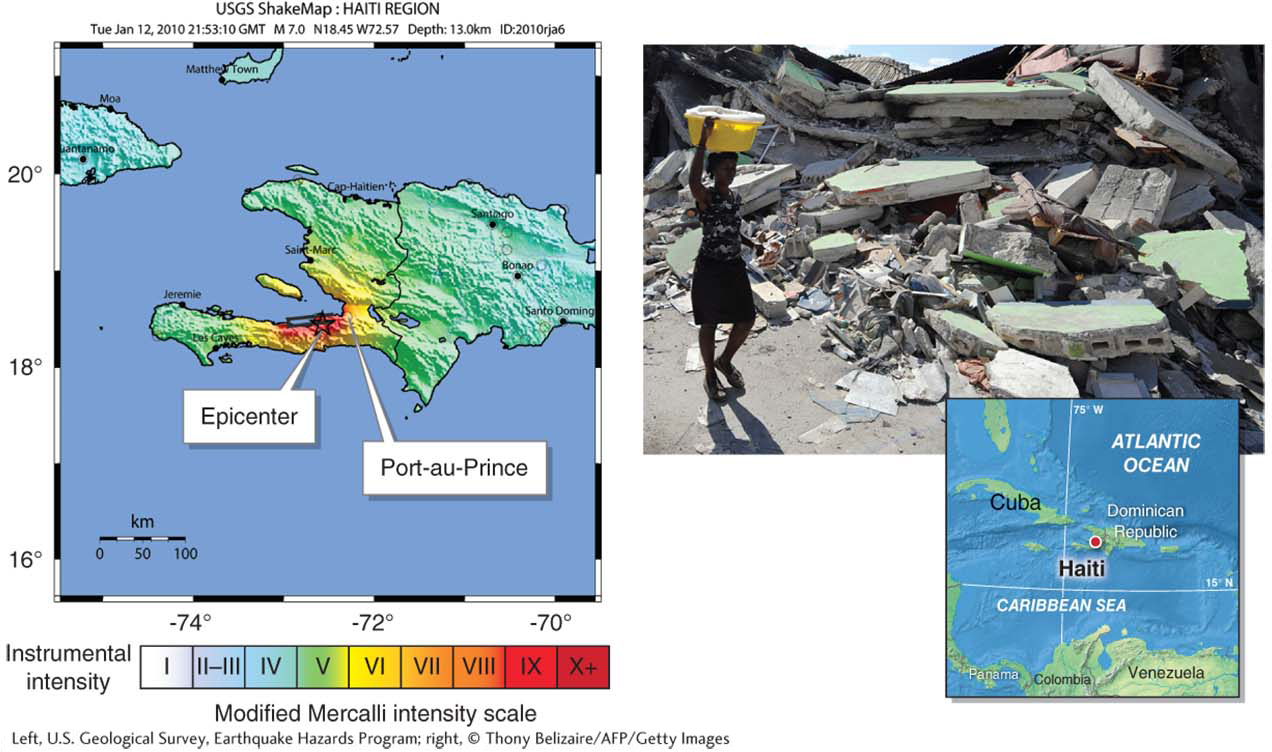
Earthquake intensity is determined by the amount of damage an earthquake causes to physical structures. The Mercalli intensity scale (or Mercalli scale) was developed in 1902 by the Italian scientist Giuseppe Mercalli as a means to estimate the intensity of shaking. No instruments are used to rank earthquakes on the Mercalli scale; instead, the scale is subjectively based on the observed damage done to structures. Later, the Mercalli intensity scale was developed into the modified Mercalli intensity (MMI) scale. In this system, earthquakes are ranked using Roman numerals, ranging from I to XII (Table 14.1).
|
CATEGORY |
DESCRIPTION |
|---|---|
|
I- |
Not felt, barely noticeable movement. |
|
IV- |
Dishes can be broken. Easily felt by those near the epicenter. |
|
VII- |
Difficult to stand upright. Poorly built structures are badly damaged. Considerable damage to well- |
|
X- |
Poorly built structures collapse. All buildings may be destroyed, and rivers may be rerouted. |
There is no single MMI value for a given earthquake. Instead, locations progressively farther away from the epicenter experience less shaking as the seismic waves dissipate with distance, so each location is given its own MMI value. Figure 14.27 provides a modified Mercalli intensity map of the 2010 Haiti earthquake.
The distance seismic waves travel through the crust depends in large part on the integrity of the crust. In the western United States, for example, many faults separate sections of the crust, and seismic waves do not travel as far as they would if the crust were not fractured. In the eastern United States, seismic waves tend to travel greater distances because there are fewer faults.
liquefaction
The transformation of solid sediments into an unstable slurry as a result of ground shaking during an earthquake.
Another factor that influences the intensity of an earthquake is the composition of the ground. Loose, wet sediments deposited by rivers or human-
Earthquake Magnitude
Earthquake magnitude is determined from measurements of ground movement using seismographs. More ground movement creates higher-
moment magnitude scale
An earthquake ranking system based on the amount of ground movement produced.
In 1935, the American geologist Charles Richter developed the Richter scale to quantify earthquake magnitudes using seismographic measurements. Richter’s system had limitations that have been addressed by several newer scales. One of these is the moment magnitude scale, an earthquake ranking system based on the amount of ground movement produced.
The moment magnitude scale relies on seismographic data to quantify ground movement. The scale also uses other types of data, such as how much the fault slipped, the amplitude of the ground movement (its up-
What Do Magnitude Numbers Mean?
Earthquake magnitude indicates both how much the ground shakes and how much energy is released:
Ground shaking: With each whole-
number increase in magnitude, 10 times more ground movement occurs. A magnitude 5 earthquake shakes the ground 10 times more than a magnitude 4 earthquake and 100 times (10 × 10, or 102) more than a magnitude 3 earthquake. Energy released: With each unit of increase in magnitude, about 32 times more energy is released. A magnitude 5 earthquake releases about 32 times more energy than a magnitude 4 earthquake and about 1,024 times (32 × 32, or 322) more energy than a magnitude 3 earthquake (Crunch the Numbers).
CRUNCH THE NUMBERS: Calculating Ground Shaking and Energy Released during an Earthquake
CRUNCH THE NUMBERS: Calculating Ground Shaking and Energy Released during an Earthquake
Compared with a magnitude 2 earthquake,
How much more ground shaking occurs during a magnitude 5 earthquake?
How much more energy is released during a magnitude 5 earthquake?
How much more ground shaking occurs during a magnitude 7 earthquake?
How much more energy is released during a magnitude 7 earthquake?
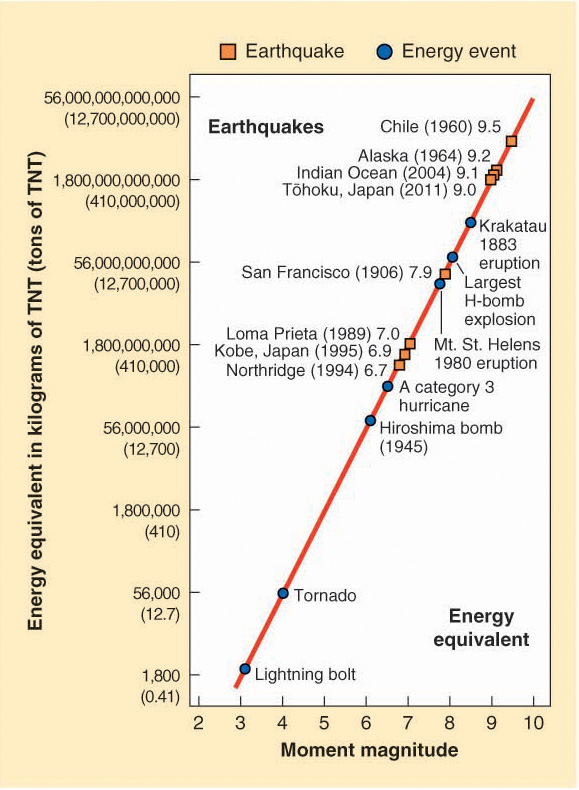
The amount of energy released by a large earthquake is phenomenal. Comparing earthquake magnitude with familiar events, or kilograms of TNT, allows us to put the power of earthquakes into perspective (Figure 14.29).
Living with Earthquakes
When you think about it, earthquakes in and of themselves are not much to be feared. Imagine that you are picnicking in an open, grassy field when a strong earthquake occurs. What would happen? You would first experience up-
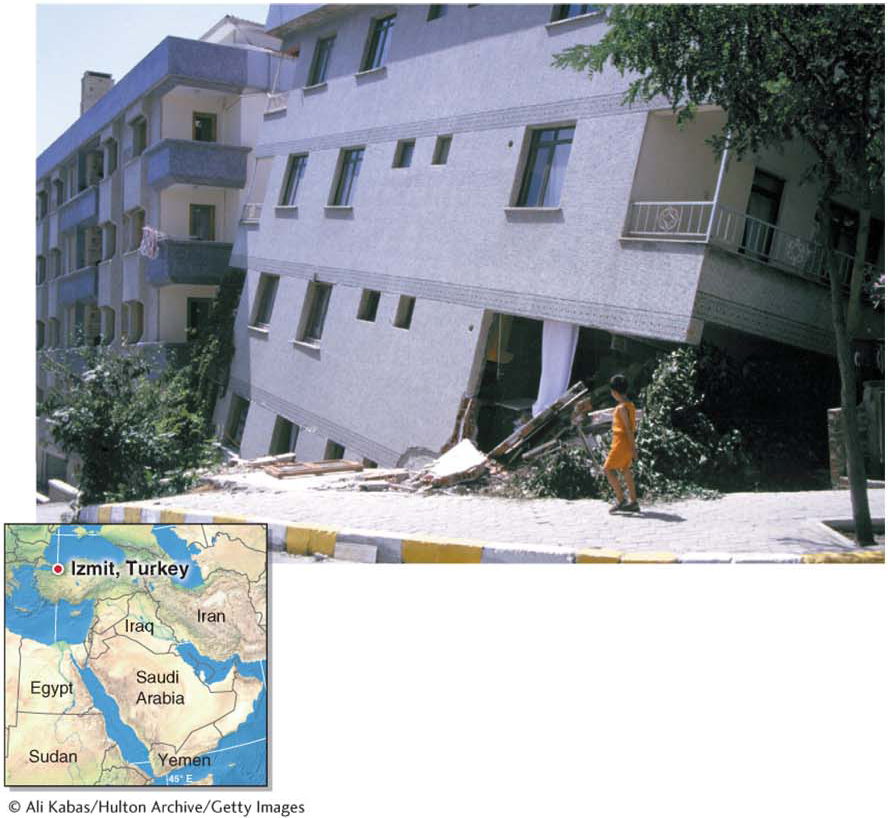
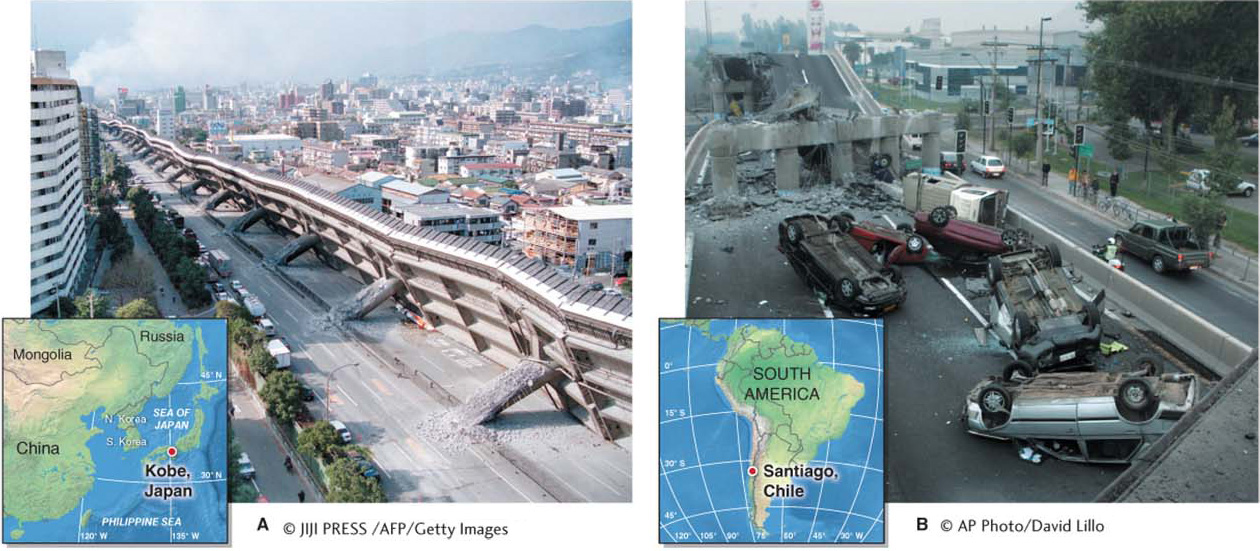
The same strong earthquake, occurring in a populated area, could bring death to thousands as structures collapse, bridges fail, bricks and glass rain down from above, and gas mains burst into flames. By itself, ground movement is not the problem—
Earthquakes are as old as Earth’s crust itself. As long as Earth’s mantle moves the crust’s plates, there will be earthquakes. So we have to learn to live with them. But what are our options?
Saving Lives
Because many lives are lost when built structures fail during earthquakes, engineers have redesigned structures to better withstand ground shaking. In the United States, building codes require that engineers build structures in accordance with the seismic risk for the region, and older structures must be retrofitted with steel support to make them safer. These building codes have made earthquakes far less of a hazard than before. Unfortunately, many countries do not have such building codes, and their residents are at risk from the collapse of buildings in earthquakes.
Another effective means of saving lives is to give earthquake warnings. Electrons in copper wire travel far faster than seismic waves in Earth’s crust. Thus, after an earthquake occurs, an automated system of alerts can be broadcast electronically. After the 2011 Töhoku earthquake, for example, people living in Tokyo, 370 km (230 mi) from the epicenter, had 80 seconds to shut off gas mains, stop trains, and seek shelter. These actions saved many lives. The USGS is developing an earthquake warning system in Southern California. This system could give downtown Los Angeles 50 seconds of warning time if a major earthquake occurred along the nearby San Andreas Fault.
Responsibility for earthquake safety also rests with every individual who lives where earthquakes are common. Table 14.2 lists some of the important ways individuals can prepare themselves for an earthquake.
|
HEAVY ITEMS |
Secure unstable heavy items, such as bookshelves, to walls and check for other objects that could become a hazard during shaking. |
|
SAFE PLACES |
Identify safe places indoors and outdoors you can quickly get to. |
|
SHUTOFFS |
Learn and then teach other family members how to turn off gas, electricity, and water to your home. Gas leaks are a common source of fires after an earthquake has struck. |
|
SURVIVAL KIT |
Keep a survival kit in a safe place. It should include a flashlight, radio, batteries, first- |
Predicting Earthquakes
Scientists cannot predict earthquakes. Many seismologists believe we will never be able to predict earthquakes because their precise timing and location are largely random. Seismologists are much better at determining long-
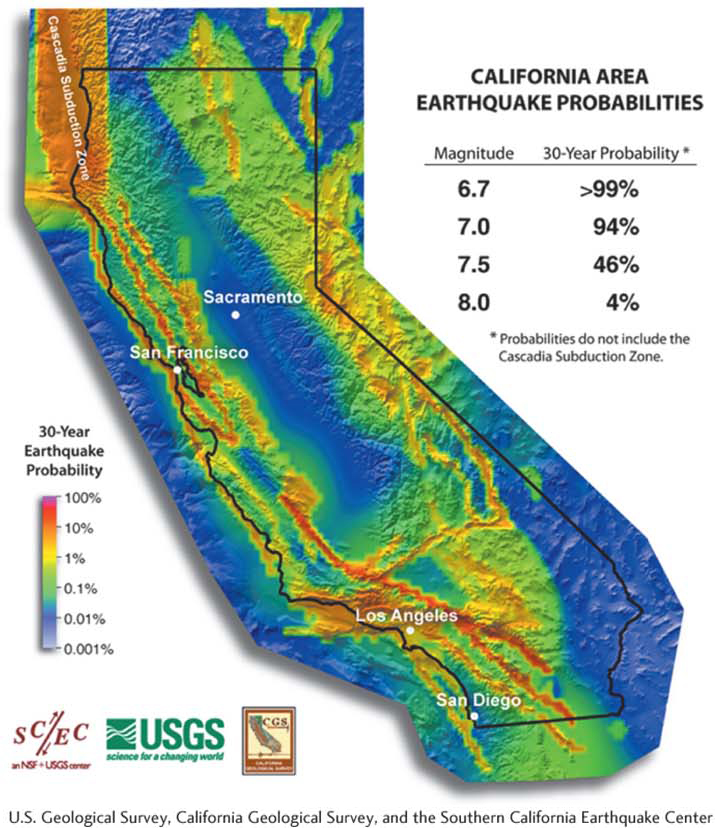
The seismic risk of an area is determined by considering many factors, including the seismic probability, the types of faults present, how active those faults have been in recorded history, and the number of people living near them. Picture This highlights a twist of events in which scientists were prosecuted for failing to adequately warn the public of an earthquake.
Picture This
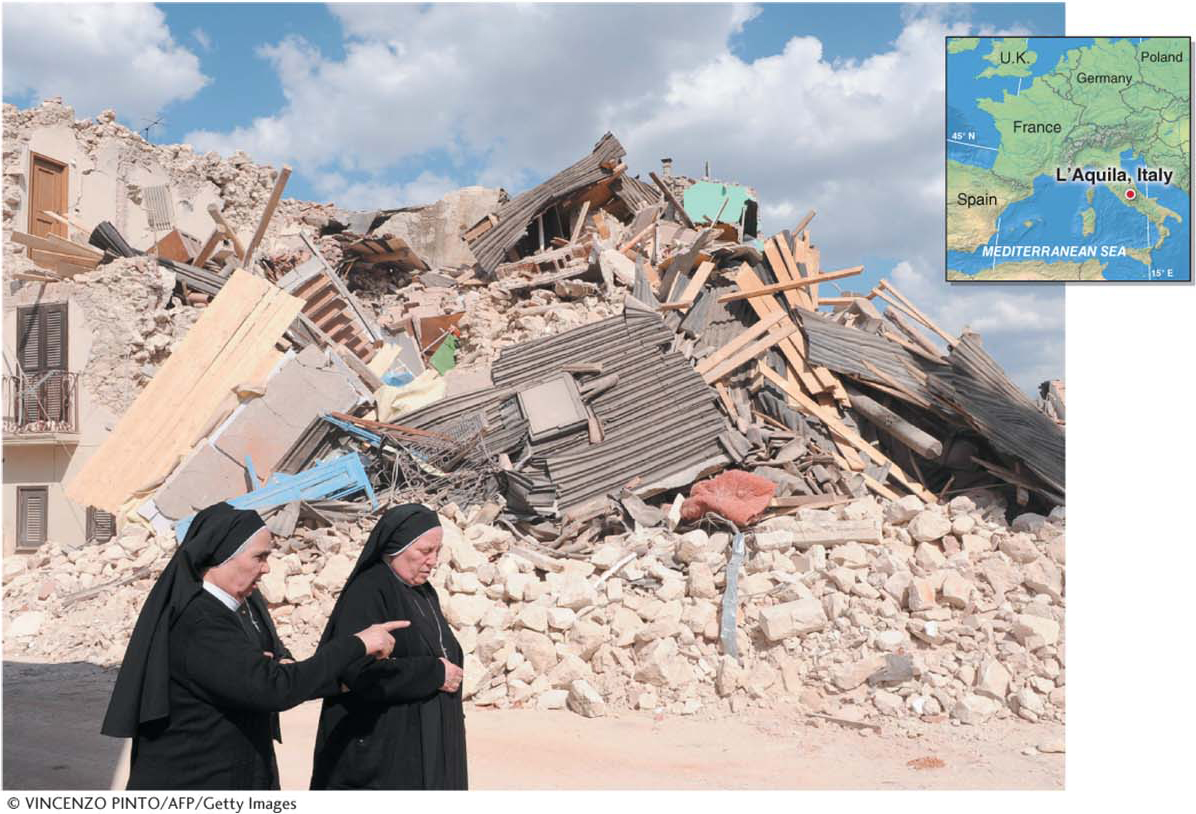
Faulting Scientists
At 3:32 a.m. on April 6, 2009, a magnitude 6.3 earthquake struck L’Aquila, Italy, destroying large portions of the city and killing 309 people. Most of Italy has a high seismic probability, and large earthquakes are certainly not unheard of there. The L’Aquila earthquake was unusual in one important way: Six scientists and a former government official were blamed for the disaster and charged with involuntary manslaughter.
There were many foreshocks before the main earthquake. The six government scientists assured the public that there was no imminent danger. Their reasoning, now known to be incorrect, was that with each little earthquake, the stress on the plates was gradually easing. Six days before the disaster, one of the scientists even told the town’s residents, who were increasingly on edge from the foreshocks, to relax and have a glass of wine.
The prosecutors representing the families of the victims based their accusations on the failure of the scientists to evaluate the seismic risk and communicate it to the public. “They were obligated to evaluate the degree of risk given all these [foreshocks],” said a prosecutor, “and they did not.” The defendants based their defense largely on the fact that scientists cannot predict earthquakes and argued that they should not be held accountable for acts of Mother Nature. They also claimed that the ruling would set a dangerous precedent. The defendants were found guilty and sentenced to six years in jail. Residents affected by the earthquake applauded the verdict.
Consider This
Question 14.8
Do you agree that the scientists should have been held accountable for this disaster and prosecuted? Explain.
Question 14.9
What other natural hazards might present a similar situation and similar liability for scientists?
Question 14.10
If scientists were held legally liable for bad predictions of natural disasters, how might the future of their scientific fields be affected?