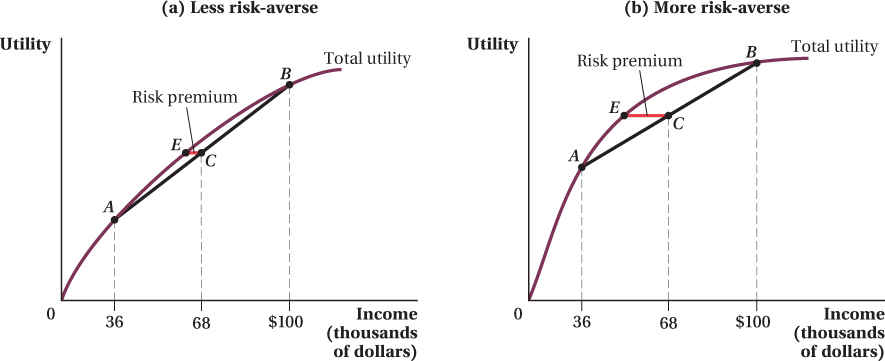
Figure 14.4 Utility Functions and Risk Aversion
The degree of risk aversion can be seen in the curvature of the utility curve. A consumer who is less ris
k-averse (panel a) has a utility function that is fairly straight, while a consumer who is more risk-averse (panel b) has a utility function that is highly curved. The risk premium that each consumer is willing to pay (distance CE) varies with his degree of risk aversion. The greater the level of risk aversion, the more curvature of the utility function, and the larger the risk premium.
