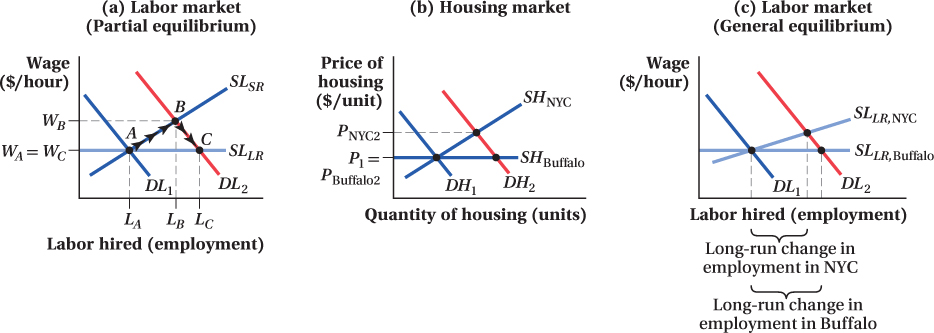
Figure 15.4 Interaction between Labor and Housing Markets
(a) An increase in the demand for labor by local firms shifts demand from
DL1 to
DL2, resulting in a shor
t-run increase in employment and wages from LA to LB and WA to WB, respectively. In the long run, workers from other cities migrate to the area. As a result, the long-run supply curve SLLR is relatively elastic, and the quantity of labor supplied increases to LC, pushing down wages to their original level at WC = WA.(b) The influx of new workers has general equilibrium effects that extend beyond the labor market. As a result of the migration to the city, demand for housing DH1 shifts out to DH2. In a market such as Buffalo where the supply of housing (SHBuffalo) is relatively elastic, housing prices stay constant at P1 = PBuffalo2. In New York City, the relatively inelastic supply of housing (SHNYC) means that housing prices will rise to PNYC2.(c) New York City’s relatively steeper long-run labor supply curve (SLLR,NYC) reflects the increase in housing prices seen in panel b, while Buffalo’s long-run labor supply curve (SLLR,Buffalo) is similar to the flat supply curve in panel a. Because of the effects of the housing market on the labor market, Buffalo will experience a greater increase in employment and a smaller increase in wages than New York City.