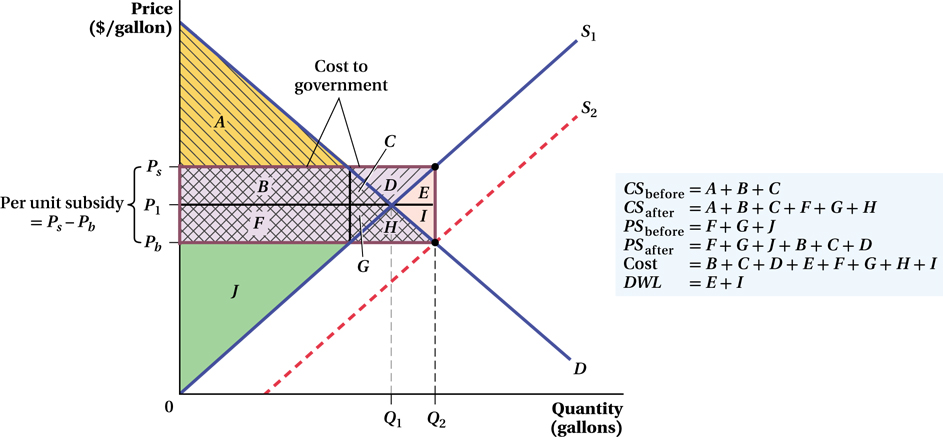
Figure 3.15 The Impact of a Producer Subsidy
In the presubsidy market for gasoline, the supply curve S1 intersects with the demand curve D at the equilibrium price P1 and equilibrium quantity Q1. The consumer surplus is A + B + C, and the producer surplus is F + G + J. After a government subsidy is put in place, the supply curve shifts down by the amount of the subsidy, Ps – Pb, to S2. At the equilibrium, the quantity increases to Q2, the price facing suppliers is Ps, and the price facing buyers is Pb. Consumer surplus is now A +B + C + F + G + H, and producer surplus is F + G + J + B + C + D. The cost of the subsidy is B + C + D + E + F + G + H + I, and the deadweight loss is E + I. Therefore, the costs associated with the subsidy are larger than the sum of the benefits to producers and consumers.