Problems
610
(Solutions to problems marked * appear at the back of this book. Problems adapted to use calculus are available online at www.macmillanhighered.com/
Peanut butter has always been thought to be a delicious, wholesome food. That is, until the FDA releases its Food Defect Guidelines that set maximum allowable amounts of rodent excreta that may be present in every jar (surprisingly, the maximum is not zero!). Following this release, the demand for peanut butter falls.
What is the immediate effect on the price of peanut butter and the quantity consumed?
Peanut butter and jelly are complements. What is the residual effect on the price of jelly?
What effect does the change in the price of jelly you indicated in part (b) have on the demand for peanut butter?
Does the demand effect you indicated in part (c) tend to push peanut butter prices and quantities back toward their original values, or farther away from them?
Following a renewable fuels mandate in 2005, the demand for yellow corn, the key ingredient in ethanol, skyrocketed.
What is the immediate effect of the increase in demand on the price and quantity of yellow corn?
The price and quantity of yellow corn increase.
Yellow corn and white corn (the key ingredients in corn tortillas) are substitutes in production. As a result of the changes in the market for yellow corn, what happens to the supply of white corn?
The supply of white corn decreases because farmers shift some of their production from white corn to yellow corn.
How does the changing supply of white corn affect its market price?
The market price of white corn increases.
As the price of white corn changes, what effect does that change have on the supply of yellow corn? Indicate the likely effects on both the price and quantity of yellow corn produced.
As a result of the increase in the price of white corn, the supply of yellow corn decreases as the farmers now shift some of their production back toward white corn. The price of yellow corn increases and the quantity decreases.
Does the change in the price of white corn tend to push yellow corn prices and quantities back toward their initial values, or farther away from them?
The increase in the price of white corn tends to push yellow corn prices further away from its initial value (as both shift, the increase in demand and the decrease in the supply of yellow corn push prices upward, whereas the quantity is pushed back toward its initial value).
The following statements describe supply and demand conditions in the markets for cheese and wine, respectively.
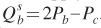
The demand for cheese is given by
 = 30 – Pc – Pw, where
is the quantity of cheese demanded each week in ounces, Pc is the price of a pound of cheese, and Pw is the price of a bottle of wine.
= 30 – Pc – Pw, where
is the quantity of cheese demanded each week in ounces, Pc is the price of a pound of cheese, and Pw is the price of a bottle of wine.The demand for wine is given by
 = 30 – Pc – Pw.
The supply of cheese is given by
 .
.The supply of wine is given by
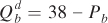
 .
.
Are wine and cheese linked on the supply side of the market, or on the demand side?
Wine and cheese are linked on the demand side of the market.
Equate supply and demand in the cheese market, and simplify to express the price of cheese as a function of the price of wine.
Qcd = 30 – Pc – Pw = Pc = Qcs
Pc = 15 – 0.5Pw
Equate supply and demand in the wine market, and simplify to express the price of wine as a function of the price of cheese.
Qwd = 30 – Pc – Pw = Pw = Qws
Pw = 15 – 0.5Pc
Substitute the expression for the price of wine you found in (c) into the equation you found in (b) to solve for the price of cheese.
Pc = 15 – 0.5Pw = 15 – 0.5(15 – 0.5Pc)
= 7.5 + 0.25Pc
0.75Pc = 7.5
Pc = $10
Plug the price you calculated in (d) into the expression you derived in (c) to solve for the price of wine.
Pw = 15 – 0.5Pc = 15 – 0.5 × 10 = $10
Plug the prices of wine and cheese you found in (d) and (e) back into either the supply or demand functions for wine and cheese to find the equilibrium quantities of wine and cheese that will be sold.
Qw = 30 – Pc – Pw = 30 – 10 – 10 = 10
Qc = 30 – Pc – Pw = 30 – 10 – 10 = 10
Consider the wine and cheese problem you solved in Problem 3. Suppose the demand for wine changes so that at every price, 10 fewer bottles are demanded.
Hold the price of cheese constant, and calculate the partial equilibrium effects of the change in the demand for wine. What happens to the price? What happens to the quantity?
Plug the new price of wine into the demand for cheese. Does the shock to the wine market cause the demand for cheese to increase or decrease?
Calculate the effect of the change in demand for cheese on the price of cheese and the quantity of cheese sold.
Plug the new price of cheese into the demand for wine. Does it cause the demand for wine to increase or decrease? Does the wine market get pushed farther from its initial equilibrium, or back toward it? How will these changes in the wine market feed back into the cheese market?
Following the steps taken in Problem 3, but using the new cheese demand function, solve for the new general equilibrium price and quantity of both wine and cheese.
How does the final general equilibrium price and quantity of wine you calculated in (e) compare to the partial equilibrium effects you calculated in part (a)?
611
Suppose that lettuce and tomatoes are goods that are related on the demand side of the market, and that both markets are in equilibrium. George and Janet are analyzing the effect of an increase in the demand for tomatoes. George is using a partial equilibrium framework, and Janet is using a general equilibrium framework.
True or False: George will predict a larger increase in the price of tomatoes than Janet will. Explain.
True or False: George will predict a larger increase in the quantity of tomatoes sold than Janet will. Explain.
True or False: The answers to parts (a) and (b) depend on whether lettuce and tomatoes are complements or substitutes. Explain.
In the central United States, farm ground is devoted to corn and beans as far as the eye can see. The supply of beans (in millions of bushels) is given by
 . The supply of corn is given by
 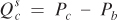 . Let the demand for beans be given by
 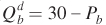 , and the demand for corn be given by
  .
.Solve the general equilibrium price and quantity of both beans and corn. (Hint: If you have trouble with this step, follow the procedures outlined in Problem 3.)
Suppose there is a shock to bean demand so that the quantity demanded at each price increases by 8 million bushels. The new demand for beans can be written as
 . Solve for the new general equilibrium price and quantity of beans and corn.
What happens to the price of beans and the quantity sold as a result of the demand increase?
What happens to the price of corn and quantity sold as a result of the increase in the demand for beans? Explain.
You are a USDA pork analyst, charged with keeping up to date on developments in the market for “the other white meat.” Recently, the demand for beef decreased.
Explain how pork and beef might be linked on the demand side of the market.
Explain how pork and beef might be linked on the supply side of the market.
You notice that within a few months, the overall quantity of pork being sold increases. Is this fact consistent with a demand-
side link between beef and pork, or a supply- side link?
Bob, Carol, and Ted are residents of a tiny commune in darkest Peru. Bob currently has a utility level (Ub) of 55 utils, Carol’s utility (Uc) is 35 utils, and Ted’s utility (Ut) is 10 utils. Alice, the benevolent ruler of the commune, has discovered a policy that will allow her to redistribute utility between any two people she chooses in a util-
to- util transfer. If Alice believes the social welfare function is given by W = min(Ub, Uc, Ut),
Recommend a transfer that will improve social welfare, if any such transfers are possible.
What is the highest level of welfare that the commune can achieve, and how must utility be divided among Bob, Carol, and Ted?
If Alice believes the social welfare function is given by W = Ub + Uc + Ut,
Recommend a transfer that will improve social welfare, if any such transfers are possible.
What is the highest level of welfare that the commune can achieve, and how must utility be divided among Bob, Carol, and Ted?
If Alice believes the social welfare function is given by W = Ub × Uc × Ut,
Recommend a transfer that will improve social welfare, if any such transfers are possible.
What is the highest level of welfare that the commune can achieve, and how must utility be divided among Bob, Carol, and Ted?
Al has found $1,000 and has decided to divide it between his children Bud and Kelly.
If Al believes that a fair division means giving equal amounts of cash to everyone, how much should he give to Bud and Kelly?
Suppose that Bud is rich and Kelly is poor. Assume that the marginal utility provided by a dollar declines the richer you are. If Al wishes to ensure that his gift provides the greatest possible collective happiness to his children, how should he divide the cash?
Suppose that Bud is rich and Kelly is poor. Assume that the marginal utility provided by a dollar declines the richer you are. If Al is concerned with distributing equal happiness to Bud and Kelly, how should he divide the cash?
How do each of your answers to (a), (b), and (c) align with some notion of fairness?
Abel, Baker, and Charlie are identical triplets with identical tastes. The utility they get from consuming various amounts of bacon, eggs, and cheese is summarized in the following table:
# of Units Consumed Utility from Bacon Utility from Eggs Utility from Cheese 1 100 60 80 2 155 110 135 3 175 150 183 4 190 180 210 5 200 200 225 Thus, if Abel has 4 pieces of bacon and 3 eggs, his total utility will be 190 + 150, or 340.
Suppose that Abel initially has 5 pieces of bacon, Baker has 5 eggs, and Charlie has 5 pieces of cheese. Assuming that bacon, eggs, and cheese all trade one-
for- one in the marketplace, suggest a series of Pareto- improving trades that will raise everyone’s overall utility. What allocation does each end up with when all gains are exhausted?
Show that once all gains are exhausted, if we force Abel to trade any of his goods for any of Baker’s goods, neither will be made better off, and at least one will be made worse off.
612
Consider the Edgeworth box diagram below, which illustrates the amount of peaches and cream in the refrigerator of Billy Joe and Bobby Sue:
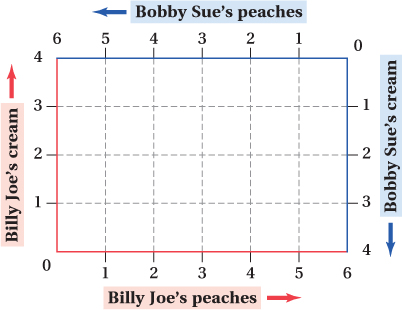
How many peaches do Billy Joe and Bobby Sue have in their fridge?
They have 6 peaches in their fridge.
How much cream do Billy Joe and Bobby Sue have in their fridge?
They have 4 pints of cream in their fridge.
Suppose that Billy Joe pulls 5 peaches and 1 pint of cream out of the fridge, and says, “You can have the rest” to Bobby Sue. Illustrate this allocation of peaches and cream by placing a point in the Edgeworth box. Label the point “A.”
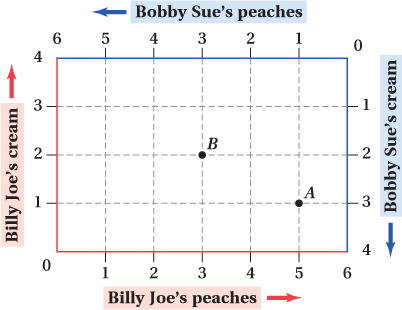
Bobby Sue pulls the remaining peaches and cream out of the refrigerator, and comments, “Hey—
I’m a bit long on cream and short on peaches here. Give me a couple of your peaches and take one of my creams.” Represent this reallocation of peaches and cream by placing a second point in the Edgeworth box. Label the point “B.”
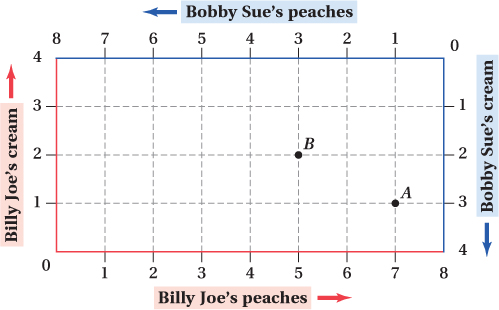
Billy Joe happens to find a couple of extra peaches behind last night’s gnocchi leftovers, and proudly proclaims, “Finders keepers!” Represent the effects of Billy Joe’s discovery by altering your Edgeworth box. Assume that Bobby Sue acknowledges and respects the “finders, keepers” rule.
Suppose Billy Joe happens to find 2 extra peaches and is permitted to keep them.
Consider the Edgeworth box below, which represents the amount of tea and crumpets available to Eliza and Henry:
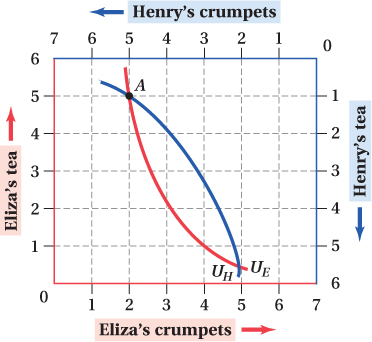
Suppose that Eliza and Henry are currently at point A. How many servings of tea and how many crumpets are each enjoying?
Suppose that while Eliza is using the powder room, Henry takes 4 cups of tea from Eliza. Feeling guilty, he leaves 2 of his crumpets on her nightstand before hastily making his exit. Show that this reallocation of tea and crumpets is a Pareto improvement.
Show that if Henry had left only 1 crumpet on Eliza’s nightstand, the reallocation would not have represented a Pareto improvement.
613
Johnny and June are divorcing and must divide their music collection, which contains two types of music: country and folk. A mediator suggests an initial division of the collection. Given the initial division, Johnny’s MRS between folk and country is 3, and June’s MRS is 1.
Use an Edgeworth box to show that the allocation of music is inefficient. Be sure to draw indifference curves for both Johnny and June, and to show their respective marginal rates of substitution at the initial allocation.
Suggest a general reallocation that could potentially make both parties better off. Explain who would have to give up folk music and who would have to give up country.
After some reallocation, Johnny’s MRS and June’s MRS are equal. Show that the allocation is Pareto-
efficient.
Consider the following Edgeworth box diagram that illustrates the preferences of Ed and Peggy for fish and chips:
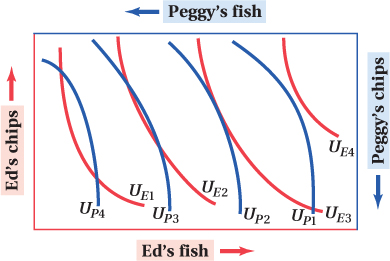
Draw the consumption contract curve corresponding to these preferences. (Hint: You may need to add some indifference curves to the diagram.)
Chris and Pat like both beer and pizza. Chris views pizza and beer as perfect one-
to- one substitutes. Pat believes that beer and pizza are perfect complements, and always consumes them in one- to- one proportions. Construct an Edgeworth box for Chris and Pat.
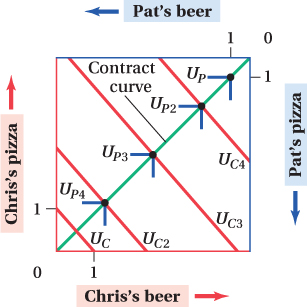
The contract curve will be at a 45-
degree line. Derive the contract curve for Chris and Pat. What shape will it take?
The contract curve will be at a 45-
degree line.
Bill and Ted like apples and oranges. Bill is always willing to substitute 1 apple for 1 orange. Ted is always willing to substitute 1 apple for 2 oranges.
Assume that there are 10 apples and 10 oranges to split between Bill and Ted. Construct an appropriately sized Edgeworth box for them.
Draw indifference curves for both Bill and Ted in your Edgeworth box. Draw Bill’s indifference curves with thick lines, and Ted’s with thin lines. (Hint: Remember that both Bill and Ted believe that apples and oranges are perfect substitutes!)
Demonstrate that any initial allocation of apples and oranges in which Bill and Ted each have some apples and some oranges is Pareto-
inefficient. Find a few Pareto-
efficient allocations; then shade the consumption contract curve. [Hint: You showed in part (c) that both parties having both goods couldn’t be efficient!]
The Edgeworth box below shows how castaways Tom and Hank are allocating labor and capital to the production of two goods, food and clothing:
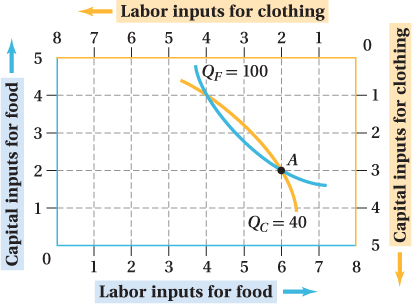
The economy is currently at point A.
How many units of labor and capital are being used in the production of each good?
There are 6 labor inputs for food and 2 for clothing. There are 2 capital inputs for food and 3 for clothing.
How many units of food are being produced? Clothing?
100 units of food and 40 units of clothing are being produced.
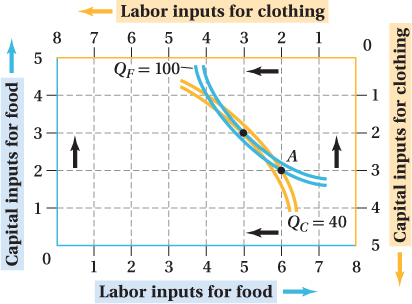
Suggest a simple reallocation of labor and capital between food and clothing that will enable Tom and Hank to enjoy more food and clothing than they currently produce.
Suppose that one less unit of labor and one additional unit of capital are being used in the food production. Hence, one more unit of labor and one less unit of capital are being used for clothing. This reallocation will enable Tom and Hank to enjoy more food and clothing than they are currently producing.
On a small tropical island, two firms draw on the same supply of labor and capital. The first firm produces fish, and in the fishing industry the marginal product of labor is 8 and the marginal product of capital is 5. The second firm produces coconuts, and in the coconut industry the marginal product of labor is 64 and the marginal product of capital is 32.
Show that the allocation of labor and capital between the two industries is inefficient.
Suggest a reallocation of labor and capital that will enable the island to produce more fish and coconuts without using more resources.
614
Consider the production contract curve in the graph below that illustrates efficient allocations of labor and capital to the production of two goods, guns and roses:
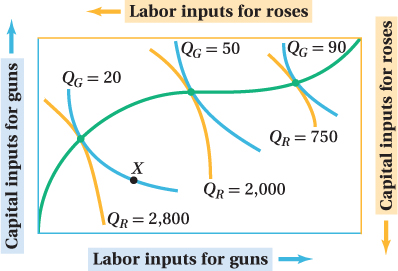
Use the information in the production contract curve to draw the production possibilities frontier for guns and roses. Put roses on the horizontal axis and guns on the vertical axis. Assume that when all resources are devoted to gun production, 100 guns can be produced; when all resources are devoted to rose production, 3,000 roses can be grown.
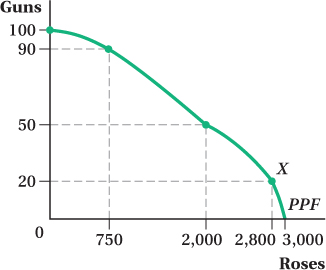
Locate point X in the Edgeworth box. Draw a corresponding point X on your production possibilities frontier. Be as accurate as possible in locating this point.
Consider the production possibilities frontier depicted below, which shows the different combinations of guns and roses an economy can produce when it uses all its inputs efficiently:
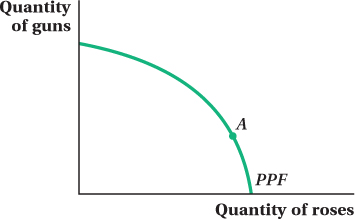
If the MRTGR at point A is 2.0, and the marginal product of labor in the gun industry is 12, what must the marginal product of labor be in the rose industry?
If the MRTGR at point A is 2.0 and the marginal product of capital in the gun industry is 6, what must the marginal product of capital in the rose industry be?