17.1 Externalities
externality
A cost or benefit that affects a third party not directly involved in an economic transaction.
negative externality
A cost imposed on a third party not directly involved in an economic transaction.
positive externality
A benefit conferred on a third party not directly involved in an economic transaction.
As we learned in the introduction, externalities exist whenever economic transactions have an impact on third parties not directly involved in the transaction. Negative externalities (such as increased West Coast pollution) impose costs on other people or firms. Positive externalities benefit third parties who are not directly involved in a transaction. A classic example of a positive externality involves bees. The bees in a beekeeper’s hives not only produce honey for the beekeeper to sell but also help pollinate the crops and flowers on neighboring properties, a beneficial service for which the neighbors often do not pay the beekeeper.
A free market usually does not produce the optimal quantity of goods with externalities present. Instead, the market will produce too much of those goods with negative externalities and not enough of the goods with positive externalities.
Why Things Go Wrong: The Economic Inefficiencies from Externalities
external marginal cost
The cost imposed on a third party when an additional unit of a good is produced or consumed.
external marginal benefit
The benefit conferred on a third party when an additional unit of a good is produced or consumed.
Externalities create inefficient outcomes because society’s overall benefit or cost from a transaction is different from the private benefit or cost to the consumer and producer involved in the transaction. Private costs and benefits are the variables we normally consider when analyzing a market. External marginal cost is the cost imposed on a third party when an additional unit of a good is produced or consumed, and external marginal benefit is the benefit conferred on a third party when an additional unit of a good is produced or consumed.
social cost
The cost of an economic transaction to society, equal to the private cost plus the external cost.
social benefit
The benefit of an economic transaction to society, equal to the private benefit plus the external benefit.
653
When there are no externalities in a market, society’s cost and benefit and private cost and benefit are the same. No external marginal costs or benefits exist. When there are externalities, the social cost (the cost to society as a whole) is the private cost plus the external cost, and the social benefit (the benefit to society as a whole) is the private benefit plus the external benefit. As we see in the next sections, incorporating social cost and benefit alters our analysis of market outcomes, including the optimal quantities and prices.
Negative Externalities: Too Much of a Bad Thing
To begin our study of negative externalities, let’s look at the air pollution created by fossil-
654
Now let’s assume that as the industry produces QMKT, it also produces particulates, ozone, and other pollutants that cause health and environmental damage to others. To make things easier, say the per-
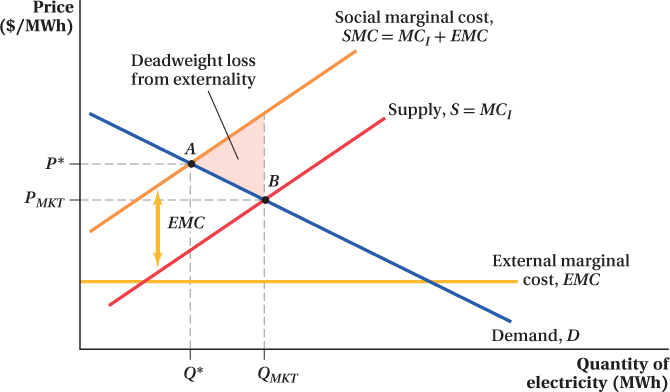
To obtain the social marginal cost, we add together MCI and EMC and come up with the curve SMC. Once the cost of the externality is taken into account, we see that society as a whole has a higher marginal cost of producing electricity than does the industry (the SMC curve is above the MCI curve). With all costs fully accounted for, total surplus is maximized at Q* and price P*, where price (demand) equals social marginal cost. Because we’ve now included the cost of the externality, the price is higher than that in the market equilibrium, and the quantity produced is lower. When the production of a good creates a negative externality and its external cost is ignored by producers, the market produces a greater level of output than is socially optimal.
The pollution externality and the market inefficiency it creates arise because the power companies in the industry do not pay pollution costs. They pay only private production costs, such as expenditures for fuel, labor, physical capital, and so on. They completely ignore the external costs that society must bear because of the pollution the industry generates. (In the real world, power companies can be required to pay some of these external costs. We discuss how this is accomplished later in the chapter.)
As a result, market output is greater than the efficient level when negative externalities are present. The true, full marginal cost of electricity production includes both the power companies’ private marginal cost and the external marginal cost of their pollution. If the firms in the industry had to pay both of these costs, the industry would choose to generate a smaller quantity of electricity.
Exactly where does the inefficiency come from? At point A, every person who buys electricity values it at least as much as it costs society to produce the electricity (including the pollution costs). The industry produces at point B, however, and the portion of the demand curve between points A and B represents consumers who value the electricity they want to purchase less than it costs society to produce. They buy the electricity only because the market price is so low. If the price reflected the true cost of the product, these consumers would not buy this electricity.
The size of the inefficiency depends on how many people buy electricity who otherwise wouldn’t if the price represented the true social cost. This is reflected in the difference between Q* and QMKT. The size of the inefficiency also depends on the discrepancy between the cost to society of producing the good and the benefit consumers obtain from it. We see this part of the loss in the size of the vertical gap between the social marginal cost curve SMC and the demand curve D: The larger this gap, the further the market outcome is from the socially optimal one.
When we put together the differences in quantity produced and in cost and benefit, we can determine the exact size of the inefficiency arising from the externality. It is the triangular area between SMC and demand D and between units Q* and QMKT. This area shows how much society’s cost of producing the excess units of electricity (reflected in the SMC curve) exceeds the consumers’ benefit from buying these units (reflected in the D curve). The triangle is the sum of the loss from each unit for which society’s costs are greater than the consumers’ benefits.
This triangle looks like the deadweight loss triangles we’ve seen before because it is a deadweight loss triangle. This deadweight loss is the reduction in social welfare that results from resources being used to produce goods for which costs exceed benefits.
655
There are many examples of negative externalities in the world. They range from huge issues in the realms of businesses and governments to smaller irritations in our everyday lives.
When BP decided to take a risk and skimp on safety on its oil rigs in the Gulf of Mexico, it saved some private cost but did not take into account the damage a spill would cause to the environment and to other industries in the region if things went wrong. Things certainly did go wrong in 2010, and it was the largest oil spill in history.
Small private jets in the United States generally pay significantly lower landing fees than large commercial airplanes do, but they crowd the airspace and lead to flight delays for others. Because the private jets do not have to pay the full cost of their flights (such as the higher costs of congestion), this is a negative externality.
When individuals decide not to get vaccinated (or decide not to vaccinate their children) against measles, they and their children become carriers who can give the disease to others. When doctors overprescribe antibiotics for patients, bacteria develop resistance to the medicine. Because both these actions impose costs on third parties, they have negative externalities.
When you go to a sporting event and the person in front of you is wearing a big hat that blocks your view, she is not including the external marginal cost in that decision.
Remember that, without incorporating external cost into production decisions, firms will supply too much of goods that have negative externalities and sell them for too low a price.
figure it out 17.1

For interactive, step-
Assume that notebook paper is sold in a perfectly competitive industry. The industry short-
Find the equilibrium market price and quantity sold.
Suppose that, in their production processes, paper manufacturers have been dumping waste in nearby streams. The external marginal cost is estimated to be $0.50 for each ream produced. Calculate the socially optimal level of output and price for the paper industry.
Solution:
First, rearrange the inverse supply and demand equations to put them in terms of quantity supplied and quantity demanded:
P = 2Q P = 40 – 8Q QS = 0.5P 8Q = 40 – P QD = 5 – 0.125P Market equilibrium occurs where QD = QS:
0.5P = 5 – 0.125P
0.625P = 5
P = $8
When P = $8,
QS = 0.5P = 0.5(8) = 4
QD = 5 – 0.125P = 5 – 0.125(8) = 5 – 1 = 4
Paper will sell for $8 per ream, and 4 million reams will be sold each year.
The social marginal cost is equal to the industry marginal cost plus the external marginal cost:
SMC = MC + EMC
= 2Q + 0.50
To find the socially optimal price and quantity, we equate the social marginal cost with the inverse demand:
2Q + 0.50 = 40 – 8Q
10Q = 39.50
Q* = 3.95
The socially optimal level of output is 3.95 million reams of paper each year.
The socially optimal price can be found by substituting the optimal quantity into either the social marginal cost or inverse demand curves:
P* = 2Q + 0.50 = 2(3.95) + 0.50 = $7.90 + 0.50 = $8.40
= 40 – 8Q = 40 – 8(3.95) = 40 – 31.60 = $8.40
Therefore, the socially optimal price is $8.40 per ream.
656
Positive Externalities: Not Enough of a Good Thing
A positive externality exists when economic activity has a spillover benefit enjoyed by third parties who are not directly engaged in the activity. Just as negative externalities create a gap between private marginal cost and social marginal cost (equal to the external marginal cost), positive externalities create a gap between the private benefit (as summarized by the demand curve) and the social benefit. The social benefit is represented by the social demand curve, which is the sum of the buyers’ private benefit (the demand curve) and the external marginal benefit.
We can explore positive externalities by looking at the decision on how many years of education to get. People benefit from getting more education, and we express that in a demand curve. There is also a cost (sometimes a huge cost!) to spending more years in school that includes not only tuition, books, and supplies, but also the opportunity cost of not being able to take a job that pays a salary while you are busy in school (which is often even more expensive than the tuition). Evidence suggests, however, that when more people in a city or a country acquire more years of education, the pay and job prospects of other people living in their area rise. One possible explanation for this link is that the more education you have, the more likely you are to start companies and hire other people. If true, there is a positive externality from your decision to spend additional years in school. The social benefit of that extra education is greater than the private benefit. It should come as no surprise then that in a circumstance like this, the free market will lead people to get fewer years of education than would be socially optimal.
To see why, consider the market for college degrees that is represented in 4
657
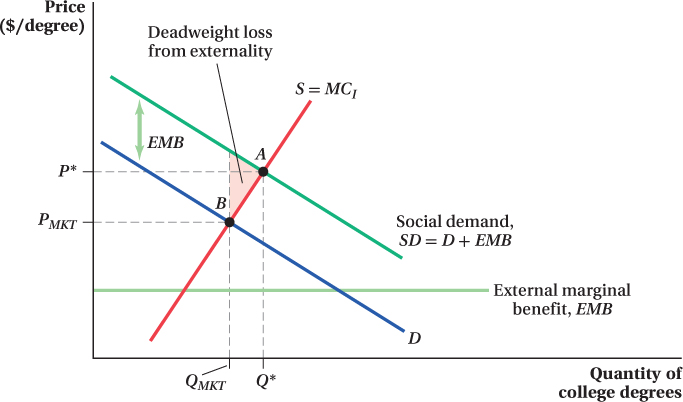
The number of students getting a college degree will be at the point where the private marginal benefit of the college degree (measured by the demand curve) equals the marginal cost of obtaining the degree (point B). Left to its own devices, then, the free-
The external marginal benefit EMB from each person getting a college degree is shown by the EMB curve.5 The social demand curve SD is the private marginal benefit (demand curve) plus the external marginal benefit. SD measures the marginal benefit of college degrees to society as a whole rather than only to the students. In Figure 17.2, SD = D + EMB.
The socially optimal number of college degrees occurs at point A, the intersection of the marginal cost curve and the social demand curve SD. At this point, Q* degrees are awarded at a price of P*. In the free-
658
Later in the chapter, we talk in detail about how governments can encourage greater production and consumption in markets with positive externalities. For now, just note that states and countries tend to subsidize college education to persuade their citizens to get more education than they would choose to acquire on their own.
Another classic example of positive externalities includes the research and development (R&D) undertaken by companies in many industries. These firms spend money to come up with new and better products, but often the discoveries they make help other firms improve their own products and come up with new ideas. Apple created the iOS operating system for iPhones and iPads through their own R&D and, in turn, this creation enabled app developers to create programs they could sell for a profit. For example, King Digital Entertainment (a computer game developer) created its Candy Crush Saga games, which have been downloaded by tens of millions of iPhone and iPad users. Without Apple’s R&D, King would not have been able to profit like this. Because Apple does not fully take account of the social demand curve when producing its R&D, it likely produces less R&D than society would like it to. The same is true for scientific research of many kinds, especially basic science research. Firms won’t produce enough R&D if they can’t fully recover or capture the social benefits of the R&D production.
Positive externalities are also attached to activities that make things safer for others or that improve the value of other people’s property. Thus, companies that spend money on cyber security help make the Internet safer for everyone, and people who invest in the appearance of their homes raise property values for the whole neighborhood.
Application: Phone-Finding Apps and Positive Externalities
David Pogue, a technology writer and TV science presenter, led the online community on a search for his smartphone after it was stolen while he was taking an Amtrak train home in 2012. When the phone was stolen, Pogue turned to his Find My iPhone app to locate the thief. Initially, the phone was turned off, so there was little he could do. Three days later, however, the app told him that the phone had been turned on and created a map with the thief’s location. Pogue shared the map with his Twitter followers and alerted the local police. The police went to the house identified on the map and, after more than an hour of searching as Twitter followers waited with bated breath, they found the phone in the grass in the house’s backyard. Find My iPhone saved the day.6
In 2013 more than 3 million smartphones were stolen in the United States. A number of apps exist that help owners track down their phones when stolen, most notably the Find My iPhone app used by Pogue, which not only creates a map with the iPhone’s current location but also locks the phone and allows owners to delete personal data. However, a 2014 survey revealed that only about 22% of smartphone owners had installed software that can locate their phone and, under the right circumstances, catch the thief.7 Why aren’t more people taking advantage of these apps? It all comes down to externalities.
Because thieves can’t tell which phones have location-
659
These findings imply that the social benefit of installing software that can locate a stolen phone is likely to be large relative to the private benefit. Most of the software’s theft-