2.2 Demand
Pike Place Market, one of the best known public markets in the world, spans several blocks in the northwest corner of downtown Seattle. It has operated continually since 1907, and on any given day hosts hundreds of vendors selling everything from fish and meat to produce and flowers to crafts and antiques. Approximately 10 million people a year visit the market.
Factors That Influence Demand
Tomatoes are a popular item for shoppers at farmers’ markets like Pike Place Market. All sorts of factors influence how many tomatoes consumers purchase at the market. Let’s discuss the most important.
Price The price of tomatoes is probably the most important consideration. Few consumers would pay $40 per pound for tomatoes, but many would pay $1 a pound.
The Number of Consumers All else equal, the more people there are in a market, the greater the quantity of the good desired. If there are a lot of people visiting the market on a given day, they will buy a relatively large amount of tomatoes.
Consumer Income or Wealth As a consumer becomes richer, she will buy more of most goods. Tomatoes (and clothes and cars and jewelry and porterhouse steaks) probably fall in that category for most people. Sometimes, however, when a consumer becomes richer, she buys less of a good. For example, she might buy a car and stop taking public transportation and might stay in nice hotels instead of youth hostels. The consumption of these goods still responds to income or wealth, but in a different direction.
Consumer Tastes A change in consumer preferences or tastes for tomatoes (for a given level of the consumer’s income and tomato prices) will change the amount of tomatoes the consumer wants to purchase. Taste changes can be driven by all sorts of forces. For example, news about the health benefits of eating tomatoes would make many consumers want to eat more of them. On the other hand, news about salmonella being found in some tomato crops will make consumers reluctant to purchase them. For other products, taste changes might arise due to a really popular advertising campaign, fads, changes in demographics, and so on.
substitute
A good that can be used in place of another good.
Prices of Other Goods Produce vendors at Pike Place Market sell other goods such as onions and peppers that consumers can use to make their salads or top their burgers. Goods that can be used in place of another good are called substitutes. When the price of a substitute good falls, consumers will want to buy more of it and less of the initial good. The lower the prices of onions and peppers relative to the price of tomatoes, the fewer tomatoes consumers will want to buy. We can also think of tomatoes in some other market (say, at another location, like a consumer’s neighborhood grocery store) as substitutes for tomatoes at Pike Place Market. If grocery store tomatoes become cheaper, shoppers at Pike Place Market are going to want to buy fewer tomatoes there.
15
complement
A good that is purchased and used in combination with another good.
Vendors at Pike Place Market also sell goods that consumers like to use with tomatoes. Goods that are often purchased and used in combination with a certain good are called complements. When the price of a complement falls, consumers will want to buy more of it and also more of the initial good. There are some goods that people like to consume with tomatoes—
The prices of substitutes and complements both affect how much of a good consumers want to buy, but they have opposite effects. A price decrease in a good’s substitute will cause consumers to want less of the good; a price decrease in a good’s complement will cause consumers to want more of the good.
Demand Curves
In economics, “demand” is a catch-
demand curve
The relationship between the quantity of a good that consumers demand and the good’s price, holding all other factors constant.
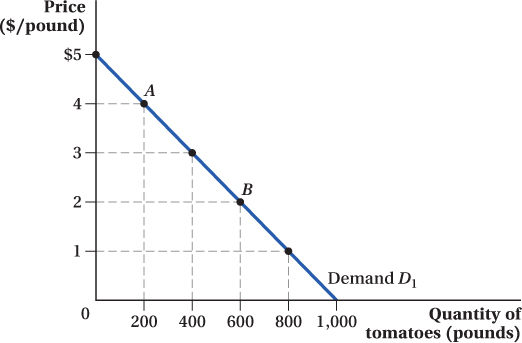
Graphical Representation of the Demand Curve The result of this simplifying assumption is a demand curve.2 Figure 2.1 depicts a demand curve for tomatoes at the Pike Place Market. The curve shows how the quantity of tomatoes that consumers want varies with the price of tomatoes. Price is on the vertical axis and quantity demanded is on the horizontal axis. This demand curve shows that when the price of tomatoes is $5 per pound, consumers do not want to buy any tomatoes. At a price of $4 per pound, consumers are willing to buy 200 pounds of tomatoes that day. At prices of $3, $2, and $1, the quantities of tomatoes demanded rise to 400, 600, and 800 pounds, respectively.
16
The point about demand curves holding all factors other than price constant is so important that it is worth saying it again: A demand curve is drawn with the assumption that there is no change in any of the other factors—
The demand curve in Figure 2.1 exhibits a fundamental characteristic of demand curves: They slope downward.3 This is another way of saying that, all else equal, the lower the price of a good, the more of it consumers will buy.
Mathematical Representation of the Demand Curve The demand curve in Figure 2.1 can also be represented mathematically by the equation
Q = 1,000 – 200P
demand choke price
The price at which no consumer is willing to buy a good and quantity demanded is zero; the vertical intercept of the inverse demand curve.
where Q is the quantity demanded (in pounds) and P is the price (in dollars per pound). This equation implies that every $1 per pound increase in price leads to a 200-
inverse demand curve
A demand curve written in the form of price as a function of quantity demanded.
Sometimes economists write this relationship in terms of the good’s price as a function of quantity. This is called an inverse demand curve. The inverse demand curve for tomatoes at Pike Place Market is P = 5 – 0.005Q. (We’ve simply rearranged the demand curve equation to put price in terms of quantity rather than the other way around.)
Shifts in Demand Curves
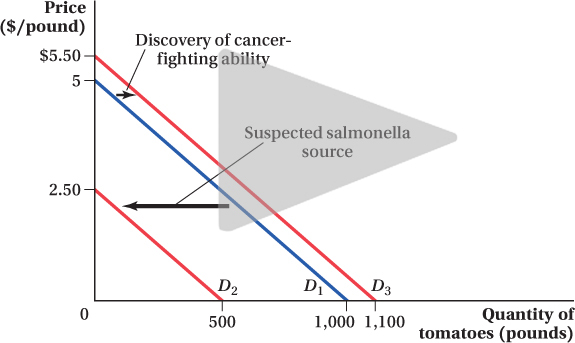
A given demand curve such as D1 in Figure 2.1 illustrates how the quantity demanded of a good changes as its price, and only its price, changes. When one of the other (nonprice) factors that affect demand changes, the change affects the quantity of tomatoes consumers want to buy at every price. For example, if there is an outbreak of salmonella poisoning, and public health officials believe that tomatoes may be the source of the outbreak, consumers’ tastes will change. They will want fewer tomatoes at any given price than they did before, and the demand curve will shift down and to the left to D2, as shown in Figure 2.2.4 Mathematically, the demand curve D2 corresponds to Q = 500 – 200P.
17
Similarly, if scientists discover that tomatoes help prevent cancer, consumers who wanted to buy 200 pounds of tomatoes at $4 per pound may now want to buy 300 pounds at $4. Those who wanted to buy 600 pounds at $2 per pound will now want to buy 700 pounds, and so on. Because consumers demand a higher quantity of tomatoes at any given price, the whole demand curve for tomatoes will shift out to the right from D1 to D3, illustrated in Figure 2.2. Mathematically, the new demand curve D3 is described by the equation Q = 1,100 – 200P. Note that we are shifting the demand curves in the simplest way—
change in quantity demanded
A movement along the demand curve that occurs as a result of a change in the good’s price.
change in demand
A shift of the entire demand curve caused by a change in a determinant of demand other than the good’s own price.
The changes in the quantity demanded at every price that occur when nonprice factors change illustrate an essential distinction. When a good’s price changes but nothing else does, this change creates a movement along a fixed demand curve. Changes in any of the other factors that influence demand create shifts in the demand curve. In terminology, economists distinguish changes in quantity demanded, which happen when a change in a good’s price creates movement along a given demand curve (e.g., the move from point A to point B in Figure 2.1), from changes in demand, which happen when a good’s entire demand curve shifts (e.g., the shifts from D1 to D2 and D3 in Figure 2.2).
We motivated the shifts from D1 to D2 and D3 in Figure 2.2 as changes in consumer tastes. But similar pictures occur for a change in any other nonprice factor that affects consumers’ quantity demanded. The increase in demand reflected by the shift to D3 would also occur if beautiful weather leads to higher attendance at the market. Of course, had the weather been cold and rainy, the number of customers at the market would fall, and the demand curve would have shifted inward to, perhaps, D2.
Why Is Price Treated Differently from the Other Factors That Affect Demand?
Why do prices get special treatment relative to the other determinants of demand? After all, nothing prevents us from putting, say, income on the vertical axis in Figure 2.1 instead of price.
18
There are at least three reasons why economists focus on the effects of a change in a good’s price. First, price is typically one of the most important factors that influence demand. Second, prices can usually be changed frequently and easily. Therefore, when we contemplate how markets respond to changes or “shocks,” price fluctuations are likely to be a common response. Third, and most important, of all the factors that influence demand, price is the only one that also exerts a large, direct influence on the other side of the market—