Problems
(Solutions to problems marked * appear at the back of this book. Problems adapted to use calculus are available online at www.macmillanhighered.com/
-
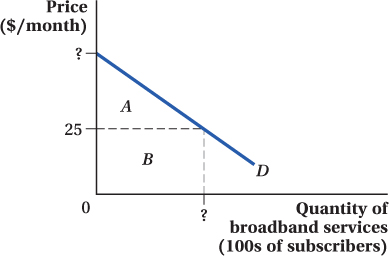
Consider the demand for broadband Internet service, given as follows: QD = 224 – 4P, where Q is the number of subscribers in a given area (in hundreds) and P is the price in dollars per month. This demand relationship is illustrated in the diagram below. Assume that the price of broadband service is $25 per month. Determine the following, paying particular attention to the units in which quantity is denominated:
The total number of subscribers at that price
The total amount paid by subscribers for broadband service, area B
The consumer surplus received by subscribers, area A
The total value to consumers of the broadband service they received, areas A and B
-
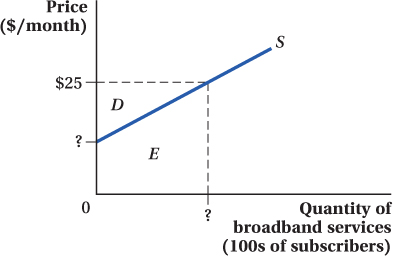
Consider the diagram at the top of the next column, which depicts the supply of broadband Internet service. The supply of broadband service is given by QS = 12.5P – 150, where Q is the quantity of services (in hundreds) and P is the price per month. Assume that the price of broadband service is $25 per month. Determine the following, paying particular attention to the units in which quantity is denominated:
The total number of services providers will supply at that price
The total amount received by producers for that service, areas D and E
The producer surplus received by suppliers, area D
Combine the graphs and equations from questions 1 and 2 and determine the following:
The equilibrium price of broadband Internet service
The equilibrium quantity of broadband Internet service
Consumer surplus
Producer surplus
The total surplus received by producers and consumers together
Increases in demand generally result in increases in consumer surplus. But that’s not always true. Illustrate a situation in which an increase in demand actually results in a decrease in consumer surplus. What conditions on the supply side of the market make this more likely to occur?
-
The Ministry of Tourism in the Republic of Palau estimates that the demand for its scuba diving tours is given by QD = 6,000 – 20P, where Q is the number of divers served each month and P is the price of a two-
tank dive. The supply of scuba diving tours is given by QS = 30P – 2,000. Solve for the equilibrium price and quantity.
Solving for the equilibrium price and quantity, we get
QS = 30P – 2,000 = 6,000 – 20P = QD
50P = 8,000
P* = $160
Thus, the equilibrium price is $160. The equilibrium quantity is
30P – 2,000 = 30 × 160 – 2,000 = 2,800
Hence, 2,800 divers are being served each year.
Find the value of the consumer surplus received by divers visiting Palau. (Hint: It may help to draw a graph.)
The demand choke price is
QD = 6,000 – 20P
0 = 6,000 – 20P
P = $300
SB-
4 Thus, the consumer surplus is

102
Find the value of producer surplus received by dive shops. (Hint: It may help to draw a graph.)
The supply choke price is
QS = 30P – 2,000
0 = 30P – 2,000
P ≈ $66.67
Thus, the producer surplus is

Suppose that the demand for scuba diving services increases, and that the new demand is given by QD = 7,000 – 20P. Calculate the impact of this change in demand on the values you calculated in parts (a) through (c).
The new demand function is QD = 7,000 – 20P. The new equilibrium price is
QS = 30P – 2,000 = 7,000 – 20P = QD
50P = 9,000
P* = $180
Thus, the new equilibrium price is $180. The new equilibrium quantity is
30 × 180 – 2,000 = 3,400
Hence, 3,400 divers are being served each year.
The new demand choke price is
0 = 7,000 – 20P
P = $350
The new consumer surplus is

The new producer surplus is

Are consumers better off or worse off as a result of the demand increase? How about producers?
The consumers are better off, as the consumer surplus increases by
$289,000 – $196,000 = $93,000
Producers are also better off, as the producer surplus increases by
$192,661 – $130,662 = $61,999
Low-
skilled workers operate in a competitive market. The labor supply is QS = 10W (where W is the price of labor measured by the hourly wage) and the demand for labor is QD = 240 – 20W. Q measures the quantity of labor hired (in thousands of hours). What is the equilibrium wage and quantity of low-
skilled labor working in equilibrium? If the government passes a minimum wage of $9 per hour, what will the new quantity of labor hired be? Will there be an excess demand or excess supply of labor? How large?
What is the deadweight loss of a $9 minimum wage?
How much better off does the $9 minimum wage make low-
skilled workers (in other words, how much does producer surplus change), and how much worse off are employers? How do your answers to (c) and (d) change if the minimum wage is set at $11 rather than at $9?
The diagram below illustrates the market for beef. Suppose that the government has instituted a price support program for beef by placing a price floor at $4.00 per pound. Under the program, any unsold beef will be purchased by the government and placed in long-
term storage. 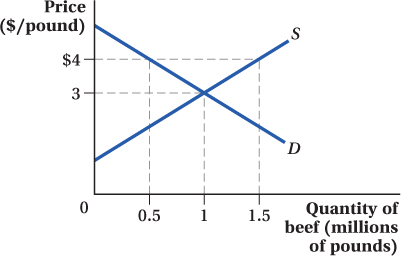
What is the cost to consumers in lost surplus?
The cost to consumers in lost surplus is
Areas A and B = (0.5 – 0) × ($4 – $3) +
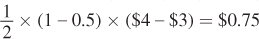
Since the quantity is measured in millions of pounds, the cost to consumers is $750,000.
What is the cost to taxpayers to purchase the unsold beef?
The cost to taxpayers is
(1.5 – 0.5) × $4 = $4
Therefore, the cost to taxpayers is $4,000,000.
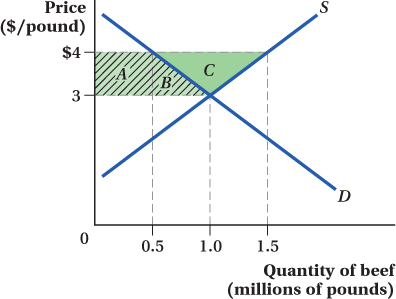
How much producer surplus do sellers of beef gain?
The gain in producer surplus is
Areas A, B, and C = Cost to consumers +
Thus, producers gain $1,250,000.
What is the loss to society of the beef program?
The loss to society is
$4,000,000 + $750,000 – $1,250,000 = $3,500,000
The president of the National Cattleman’s Association makes the following semi-
extortionary offer to consumers: “Pay us $2.2 million per month forever and we’ll lobby our congressmen to abandon the price support program.” Should consumers pay the Cattleman’s Association? Why or why not? The gain of producers from the scheme is $1,250,000. Therefore, compensating the producers marginally above their gain should suffice. It costs consumers and taxpayers collectively $2.2 million instead of $4.75 million; the scheme is better for all parties concerned.
Broccoli is a superfood, and the Surgeon General wants people to eat more of it. “People would eat more broccoli if it didn’t cost so much,” she says. She proposes placing a $1 per pound price ceiling on broccoli, well below its $2 per pound free-
market price. Will her plan, which makes broccoli twice as affordable, help achieve her goal? Draw a supply and demand diagram to explain your answer. You know that price ceilings are socially costly in that they create deadweight losses. But they may be costly in other ways, too. Suppose the government imposes a price ceiling of $1 per loaf on bread. Enumerate at least two ways in which this regulation will cause resources to be wasted beyond the deadweight loss it creates.
Black markets are markets where items are sold in violation of government rules and regulations.
Suppose that the government imposes a $1 per loaf price ceiling on bread sales, well below its free-
market price. Explain how the existence of a black market for bread could potentially improve society’s well- being. Suppose that the government establishes a $20 per bushel price floor in the market for corn. Explain how the existence of a black market for corn could potentially improve society’s well-
being.
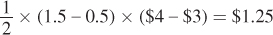
Draw a graph illustrating the impact of imposing a quota on production in a market, where the quota is less than the current equilibrium quantity. What happens to the price of the good, producer surplus, and consumer surplus? Show the deadweight loss from the quota.
The price increases from P* to PQuota. The producer surplus before the introduction of the quota was represented by areas D and E. After the quota, the producer surplus is areas B and D. The overall effect on the producer surplus is ambiguous and depends on the elasticities of supply and demand. In this illustration, area B is larger than area E, and so there is a net gain for producers. The consumer surplus before the introduction of the quota was areas A + B + C. After the quota, the consumer surplus shrunk to area A. The deadweight loss is areas C + E.
For decades, the mob ran a “numbers game” in which participants who matched three numbers chosen at random would win a prize. In the 1970s, state governments began authorizing state lottery commissions; those commissions typically offered games similar in structure to the numbers game. Using supply and demand analysis:
103
Predict the effect of the creation of state lotteries on the number of people playing numbers-
type games. Predict the effect of the creation of state lotteries on the number of people playing mob-
run numbers games. Predict the effect of the creation of state lotteries on the price of playing a numbers-
type game. Numbers games are unusual in that tickets don’t typically vary in their nominal price — most tickets sell for exactly $1. Given that the nominal price is fixed, how might the price change you indicated in (c) be achieved?
Advocates of small government complain that two proposed government programs will steal the market from small businesses: One program will foster a major increase in the government production of bread; the second will increase the government production of manicures. If the demand for bread is highly inelastic, and the demand for manicures is highly elastic, which program should worry small-
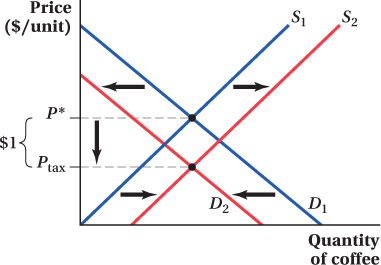
government proponents the most? Explain your answer with a diagram. In the market for coffee, the elasticity of demand is estimated to be –0.6 and the elasticity of supply is estimated at 1.2. If the government imposes a $1 tax on each cup of coffee sold, what share of that tax will be paid by buyers, and what share will be paid by sellers?
You are a USDA economist, and the Senate Finance Committee has come to you for advice. The government is considering bolstering its finances by imposing a tax on either salt or blue cheese. You know that the markets for salt and blue cheese are roughly the same size, though the demand for salt is highly inelastic, while the demand for blue cheese is highly elastic. Which option do you recommend as the least costly choice?
-
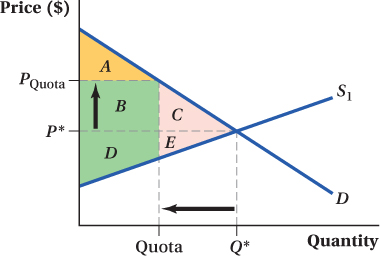
The demand for ice cream is given by QD = 20 – 2P, measured in gallons of ice cream. The supply of ice cream is given by QS = 4P – 10.
Graph the supply and demand curves, and find the equilibrium price and quantity of ice cream.
The inverse demand function is
QD = 20 – 2P
P = 10 – 0.5QD
The inverse supply curve is
QS = 4P – 10
P = 2.5 + 0.25QS
The equilibrium price is
QD = 20 – 2P = 4P – 10 = QS
6P = 30
P* = $5
The equilibrium quantity is
20 – (2 × 5) = 10 gallons of ice cream
Suppose that the government legislates a $1 tax on a gallon of ice cream, to be collected from the buyer. Plot the new demand curve on your graph. Does demand increase or decrease as a result of the tax?
The demand curve shifts inward by the amount of the tax. See graph below.
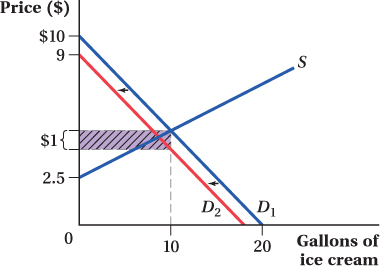
As a result of the tax, what happens to the price paid by buyers? What happens to the price received by sellers? How many gallons of ice cream are sold?
The buyers face a new price PS + TAX, and sellers sell at PS:
QD = 20 – 2 × (PS + 1) = 4PS – 10 = QS
6PS = 28
PS ≈ 4.67
Hence, buyers pay $5.67 and sellers sell at $4.67.
The quantity sold is
(4 × $4.67) – 10 = 8.68
Who bears the greater burden of the tax? Can you explain why this is so?
After the $1 tax, buyers pay $5.67 for a gallon of ice cream. After the buyers send in the tax, the sellers only end up with $4.67 per gallon sold. Therefore, of the $1 going to the government, approximately 67% of it is coming out of consumers’ pockets because their price went up by 67 cents per gallon. The price realized by the suppliers goes down by approximately 33 cents per gallon. The incidence of this tax is 67% on the buyers and 33% on the seller. Hence, buyers bear a proportionately greater burden of the tax. This happens when demand is relatively inelastic when compared to supply, which in this case is relatively elastic.
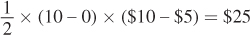
Calculate consumer surplus both before and after the tax.
Before the tax, the demand choke price is $10 per gallon of ice cream. Hence, the consumer surplus is
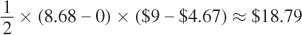
After the tax, the demand choke price is $9 per gallon of ice cream. Hence, the consumer surplus is
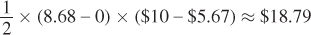
Or if you reduce the choke price and use the gross price of $4.67, the consumer surplus is still
Calculate producer surplus both before and after the tax.
Before the tax, the supply choke price is $2.50 per gallon of ice cream. Hence, the producer surplus is
After the tax, the producer surplus is
How much tax revenue did the government raise?
The tax revenue raised by the government is
$1 × 8.68 ≈ $8.68
How much deadweight loss does the tax create?
Due to the tax, quantity falls by 1.33 units. The tax creates a deadweight loss of
0.5 × $1 × 1.33 ≈ $0.67
Social Security taxes are taxes on the sale of labor services. Half of Social Security taxes are generally collected from the employer and half from the employee. Does this seem like a good way to structure the tax collection? Can the government dictate who bears what share of the burden of a tax? Explain.
The U.S. Senate is considering a bill that would tax the sale of laptop computers in order to fund a computer education program for presidential hopefuls. The Congressional Budget Office (CBO) estimates that if it implements a low tax of $12 per laptop, revenue should be sufficient to exactly fund the program. The CBO also estimates that a high tax of $230 per laptop will exactly fund the program.
How can both a low tax and a high tax raise exactly enough money to fund the program? Illustrate your answer using a graph.
Suppose that you are an economic advisor to the Senate Finance Committee, tasked with analyzing the economic impact of the tax proposals. Which proposal do you recommend, and why?
Consider the following fiscal scheme designed to directly transfer welfare from coffee drinkers to coffee vendors: The government will impose a $1.00 tax, collected from buyers, for each cup of coffee sold. The government will then subsidize coffee vendors $1.00 for each cup of coffee sold.
What will happen to the equilibrium price of coffee?
The equilibrium price of coffee would go down.
What will happen to the equilibrium quantity of coffee?
The equilibrium quantity of coffee depends on the elasticities of supply and demand; therefore, the change can occur in any direction.
How will the outcome of this scheme differ from one in which the government collects a $1.00 tax for each cup of coffee sold and divides the total tax collections equally among all coffee vendors? (It is safe to assume that all coffee vendors are identical.)
In the first scheme, the subsidization has an effect on the equilibrium price and quantity of coffee after the introduction of the tax. In particular, the subsidization will decrease the equilibrium price and increase the equilibrium quantity of coffee. In the second scheme, after the introduction of the tax, splitting the revenue among coffee vendors does not cause any change to the equilibrium price and quantity.
104
A tax increases the price paid by buyers and reduces the price received by sellers; it makes society worse off. In contrast, a subsidy reduces the price paid by buyers and increases the price received by sellers. True or false: Because a subsidy’s effects are the opposite of a tax’s effects, the subsidy must make society better off. Explain your reasoning.
Government believes that access to the Internet is essential in today’s society, and to bolster access, it proposes subsidizing the purchase of mobile devices. The inverse demand for mobile devices is given by P = 500 – 0.1QD. The supply is given by P = 200 + 0.1QS.
Solve for the equilibrium price and quantity in this market, and calculate producer and consumer surplus.
Suppose the government offers a $100 per unit subsidy to sellers of mobile devices. Alter the equation for the inverse supply curve to reflect the subsidy.
With the subsidy in place, how many mobile devices will be sold? What will the price paid by buyers be? The price received by sellers?
What will the subsidy program cost the government? What will the net effect of the subsidy on total surplus in society be?
 Work this problem with calculus