3.3 Quantity Regulations
Sometimes, rather than regulating prices, governments impose quantity regulations. We discuss some of these regulations and analyze their effects on market outcomes in this section.
Quotas
quota
A regulation that sets the quantity of a good or service provided.
A quota is a regulation mandating the provision of a certain quantity of a good or service. Quotas are occasionally used to force firms to produce a certain amount of a good (say, a vaccine in preparation for a flu epidemic or armaments during a war), but most often they are used to limit the amount of a good that is produced.
For example, countries wanting to limit imports but not wanting to publicly announce tariffs (taxes on imports) can limit imports by establishing a quota. The U.S. government imposes quotas on the amount of sugar that can be imported from various countries, for example.7 In other circumstances, a government may limit the amount of fish people can catch or the production of milk or oil.8 France limits the amount of U.S. television shows that can be broadcast on TV. Singapore limits the number of cars that people can buy. London’s Heathrow Airport limits the number of direct flights from U.S. airports.
Zoning laws impose another type of quota. Most towns and cities have zoning laws that limit the amount or type of construction that can go on in a certain area. A common zoning restriction limits the number of certain businesses considered by some to be unsavory, such as pawn shops or tattoo parlors. Such restrictions can be thought of as quotas on the amount of services these stores can provide in a local market.
Let’s consider as an example the impact of a quota on the amount of tattoo services that can be provided in the fictional town of River City where a concerned town council wants to limit tattoos.
Suppose the city’s demand curve for tattoos is Qd = 2,500 – 20P, and the supply curve is Qs = 100P – 3,500, where the quantities demanded and supplied are both measured in the number of tattoos per year. We can analyze the effects of a quota on price and quantity by using graphs or equations.
81
Graphical Analysis In the free market, the equilibrium quantity of tattoos supplied and demanded in River City is 1,500 tattoos per year at a price of $50 per tattoo (Figure 3.10). The consumer surplus in this market is A + B + C and the producer surplus is D + E + F.
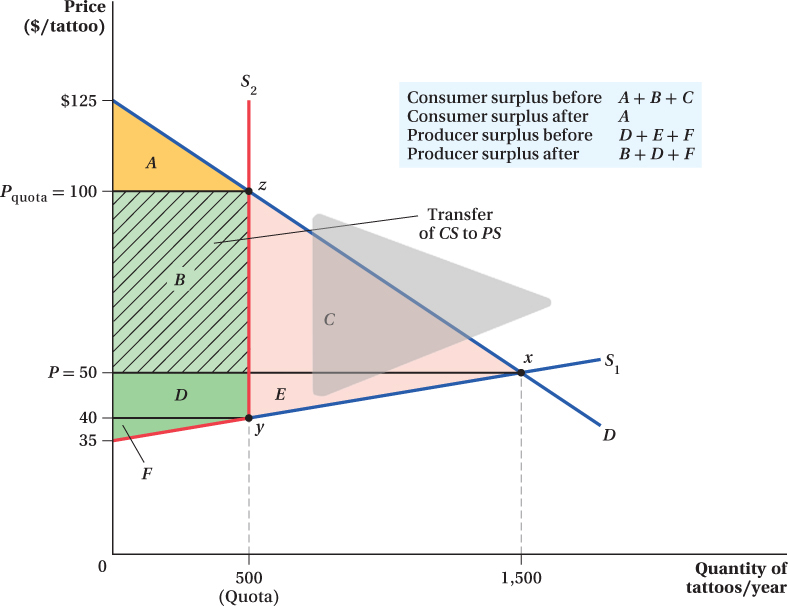
Suppose that River City’s mayor believes tattoo shops are a blight on society and rules that no more than 500 tattoos can be purchased per year in the city. He enforces this quota by requiring everyone who wants a tattoo to buy a tattoo permit before getting inked.
The quota creates a regulatory bend in the supply curve so that it becomes vertical at the quantity of 500. In other words, no matter what the price of tattoos is, parlors cannot supply more than 500. When this happens, the supply curve becomes perfectly inelastic at 500, making the new supply curve S2 look like the red line in Figure 3.10. Now the demand curve intersects supply at point z rather than at point x, and the price rises from $50 to $100. Consumer surplus falls from area A + B + C to area A, which is the only area that is below the demand curve and above the postquota price Pquota. The postquota producer surplus is above the supply curve and below the new price. This area B + D + F includes a surplus transfer B from consumers to producers. The area C + E is the deadweight loss.
82
Analysis Using Equations The equilibrium price is the price that exists when quantity supplied equals quantity demanded:
QD = QS
2,500 – 20P = 100P – 3,500
Solving for P and Q, we find
P = $50 and
QD = 2,500 – 20(50) = 1,500
or
QS = 100(50) – 3,500 = 1,500
At the free-
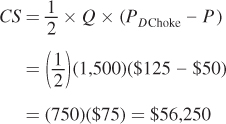
The demand choke price PDChoke is the price at which QD = 0, which in this case is
QD = 2,500 – 20(PDChoke) = 0
20PDChoke = 2,500
PDChoke = $125
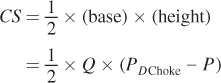
Consumer surplus is therefore
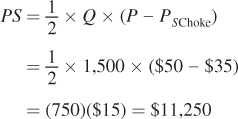
The producer surplus is the triangle D + E + F in the graph. That triangle’s area is
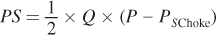
The supply choke price PSChoke is the price at which quantity supplied is zero:
QS = 100 (PSChoke) – 3,500 = 0
PSChoke = 3,500/100 = $35
Producer surplus in the unregulated tattoo market is then
After the 500-
QS = QD
500 = 2,500 – 20Pquota
Pquota = $100
83
At this price, the consumer surplus is the area A:
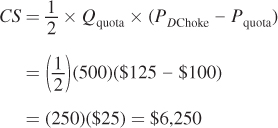
This is dramatically reduced from the free-
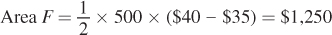
The producer surplus is measured by the areas B + D + F. We can break out each of these areas separately:

The price at point y is the price at which the quantity supplied is equal to the quota. It can be determined by setting QS = 500 and solving for P:
QS = 100(price at point y) – 3,500 = 500
100(price at point y) = 4,000
Price at point y = 4,000/100 = $40
So this means
The rectangle B is
Area B = Qquota × (Pquota – P )
= 500($100 – $50) = $25,000
and the rectangle D is
Area D = Qquota × (P – price at point y)
= 500($50 – $40) = $5,000
Thus, the total producer surplus equals F + B + D = $31,250.
Let’s compare the quota outcomes to those of the free, unregulated River City tattoo market. Consumers are much worse off after the quota because their surplus has fallen from $56,250 to only $6,250. This decrease reflects, in part, the losses of the additional 1,000 people who would be willing to get a tattoo in River City in a free market but cannot with the quota in place. But the loss in consumer surplus also reflects the fact that the quota increases the price of tattoos even for those people who get one. This price increase shrinks the gap between what they are willing to pay for the tattoo and the price they actually have to pay.
On the supply side, the tattoo parlors do just fine. They lose the producer surplus in area E when the quota is imposed, but the quantity restriction leads to much higher prices for their output—
84
The quantity-