Problems
(Solutions to problems marked * appear at the back of this book. Problems adapted to use calculus are available online at www.macmillanhighered.com/
Show, using indifference curves and budget constraints, that
all goods can be normal, but
all goods cannot be inferior.
Joelle consumes food and clothing. For incomes near her current ncome, her income expansion path is negatively sloped. Indicate whether each of the following statements is true or false, and provide a brief explanation why. (You may want to use a graph in formulating your explanation.)
At current income levels, food must be an inferior good.
At current income levels, clothing must be an inferior good.
At current income levels, food and clothing must be inferior goods.
At current income levels, either food or clothing must be an inferior good.
Suppose that, holding prices constant, Alice has preferences over the number of books she purchases that look like:
Income (thousands of dollars) Optimal number of books purchased 5 5 10 6 15 20 20 25 25 26 30 10 35 9 40 8 45 7 50 6 Draw a smooth approximation of Alice’s Engel curve for books, indicating the ranges over which books are inferior goods and over which they are normal goods.
A luxury good is a good that has an income elasticity greater than 1. Give the ranges in which books are luxury goods for Alice.
Kim’s utility function is given by U = XY. For this utility function, MUx = Y and MUy = X.
If good X costs $6, and good Y costs $3, what share of Kim’s utility-
maximizing bundle is made up of good X? Of good Y? If the price of good Y rises to $4, what happens to the shares of X and Y in Kim’s utility-
maximizing bundle?
Consider the following graph, which illustrates Tyler’s preferences for DVD rentals and in-
theater movie tickets: 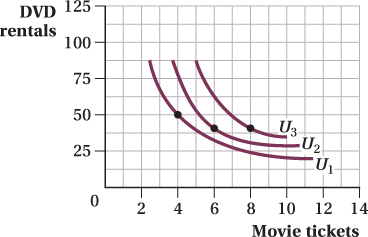
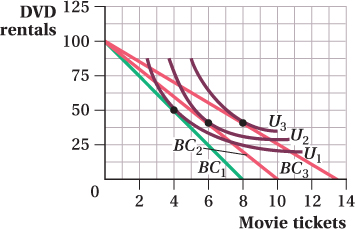
Suppose that DVD rentals always cost $1, and that Tyler’s income is $100 per week.
If the price of a movie ticket is $10, draw Tyler’s budget line. Be very careful to draw to scale. How many movies does he see in the theater?
When the price of a movie ticket is $10, Tyler sees 6 movies in the theater.
Begin to draw Tyler’s demand curve for movies by creating a new set of axes with price on the vertical axis and the quantity of movies on the horizontal axis. Plot a point that shows how many movies Tyler demands when the price of movies is $10.
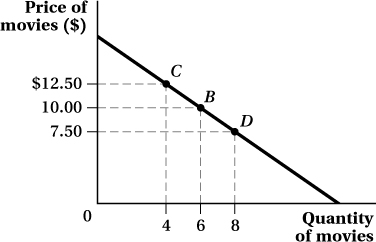
The movie theater changes the price of tickets to $12.50. Modify the graph provided to reflect this price change. Then add a point to your demand curve graph to show how many movies Tyler demands at a price of $12.50.
Tyler’s mother gives him a discount card that allows him to purchase movie tickets for $7.50 each. Modify the graph provided to reflect this price change. Then add a point to your demand curve graph to show how many movies Tyler demands at a price of $7.50.
Connect the dots in the graph you created to complete Tyler’s demand curve for movie tickets.
191
-
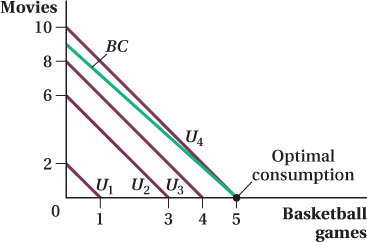
Carmen’s preferences are such that she is always indifferent between watching two movies or seeing one basketball game.
What must Carmen’s indifference curves look like?
Carmen’s indifference curves are straight, parallel lines. For her, watching a movie and seeing a basketball game are perfect substitutes. Carmen’s utility function can be described as U = X + 2Y, where X denotes the basketball games and Y denotes the movies.
Suppose that Carmen has an income of $90. If a movie costs $10 and a basketball game costs $18, what will Carmen’s optimal consumption bundle be?
The optimal consumption bundle is to buy 5 basketball games in order to reach the highest feasible indifference curve U4 given the budget constraint.
Armen lives in Washington State, where grapes are grown. Armen’s twin Allen lives in New York, where grapes must be trucked in from Washington at a fixed cost of $0.20 per pound of grapes. Armen and Allen have identical tastes, but Armen tends to purchase lower-
quality grapes and Allen tends to purchase higher- quality grapes. Use indifference curve analysis to explain this oddity. Klaus cares only about how much he can write. Because a pen will write 7 miles of text and a pencil will write 35 miles of text, Klaus considers them perfect 5 to 1 substitutes. If the price of pens is given by Ppen and the price of pencils is given by Ppencil, and if Klaus’s income is given by Y, use indifference curve analysis to derive the demand curve for pencils.
Consider the following three graphs, which illustrate the preferences of three consumers (Bob, Carol, and Ted) regarding two goods, apples and peaches. Each consumer has an income of $30, and each consumer pays $2 for apples and $3 for peaches.
Suppose that the price of peaches falls to $2. Draw a new budget line for each consumer and find the new optimal bundle of apples and peaches each would buy. How does the new quantity of peaches compare to the original quantity? Indicate the change in the first column of the table below (an increase of 1 unit might be denoted as a +1).
For each consumer, determine the substitution effect of the price change by drawing a hypothetical budget line with the same slope as your new budget line, but just tangent to the consumer’s original indifference curve. How much of a change in peach consumption does the substitution effect account for? Indicate that change in the second column of the table below.
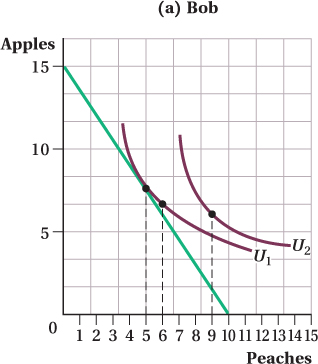
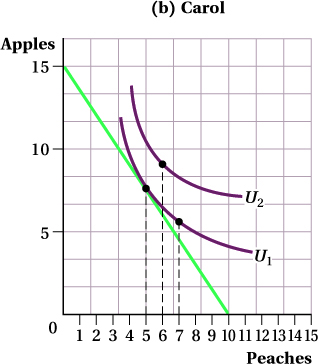
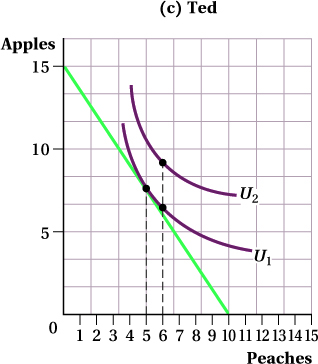
Now add in the income effect. Compare each consumer’s peach consumption in (b) to his or her final peach consumption in (a). Indicate the difference in column 3 of the table below. Double-
check your work to ensure that the last two columns add up to the number in the first column. Do Bob, Carol, and Ted consider peaches normal, inferior, or income inelastic?
Total Effect of Price Change Substitution Effect of Price Change Income Effect of Price Change Bob Carol Ted
192
Suppose that Sonya faces an increase in the price of pasta, as depicted below, moving her from an optimal bundle of rice and pasta at A to an optimal bundle at B.
Trace a copy of this diagram. Graphically depict the substitution and income effect.
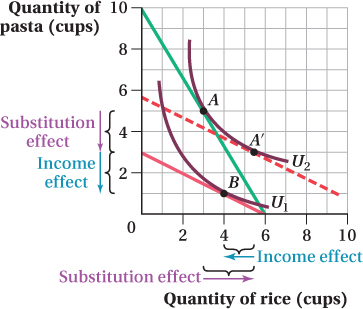
Which effect is strongest? How can you tell?
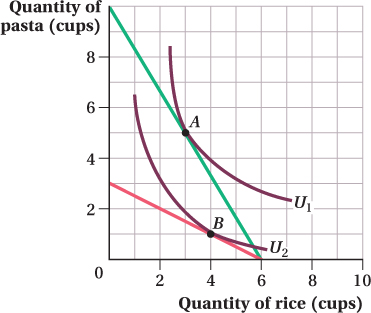
The two effects seem to be equivalent in magnitude for pasta with a decrease of 2 cups of pasta for each effect. As far as rice, the substitution effect dominates the income effect; in particular, the substitution effect leads to a 2-
cup increase in rice consumption, whereas the income effect causes rice consumption to fall by 1 cup.
-
Brady, who has ordinary-
shaped indifference curves, buys 16 ounces of salt each year. Even when the price of salt doubles, Brady continues to purchase exactly 16 ounces. Use indifference curves and budget constraints to depict Brady’s behavior graphically. Put salt on the horizontal axis and a composite good on the vertical axis.
True or False (and explain): Salt is neither inferior nor normal to Brady.
What is Brady’s price elasticity of demand for salt?
What can we say about Brady’s income elasticity of demand for salt?
What can we say about the substitution and income effects of a change in the price of salt?
Explain intuitively why any normal good cannot possibly be a Giffen good. (You may wish to illustrate your answer with a budget line/indifference curve graph.)
During the Irish potato famine of the mid-
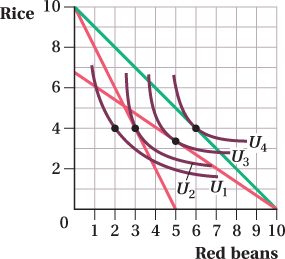
1800s, potato blight caused a massive reduction in the supply of potatoes. The price of potatoes soared to historically unprecedented levels. Use this evidence to explain why (or why not!) potatoes were a Giffen good in mid- 1800s Ireland. Consider the following diagram, which illustrates Gaston’s preferences for red beans and rice. Gaston has an income of $20. Rice costs $2 per serving.
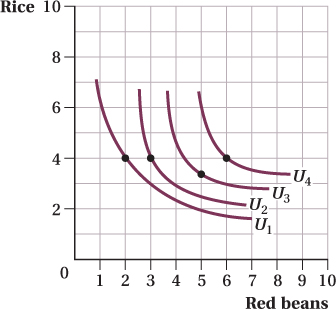
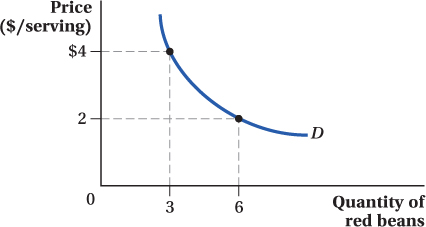
Derive Gaston’s demand for red beans. Use prices of $2 and $4 in your analysis. Graph your results, and connect the points you plotted to yield Gaston’s demand for red beans.
Gaston’s demand for red beans
Suppose that the price of rice increases to $3. Again, derive Gaston’s demand for red beans using the same prices you used in part (a).
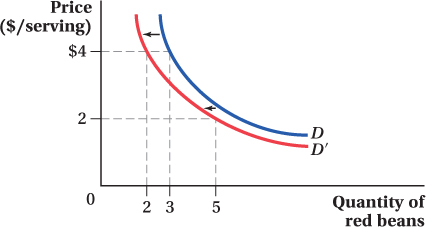
Does Gaston’s demand for red beans increase or decrease as a result of the increase in the price of rice?
When the price of rice increases to $3, the demand for red beans decreases.
Does your answer to (c) indicate that red beans and rice are substitutes or complements?
The changes in prices and quantities are consistent with the definition of complements.
193
-
Consider Liu’s indifference curve indicated in the graph below:
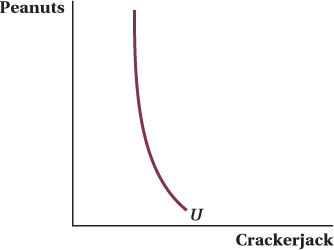
True or False (and explain): Peanuts and Crackerjack are clearly complements.
True or False (and explain): Peanuts and Crackerjack are clearly both normal goods.
-
True or False: If pizza and calzones are substitutes, then the substitution effect of a price change will be in a different direction than if pizza and calzones are complements. Explain, using a diagram.
You may have noticed that the market demand curve is always at least as flat as individual demand curve. Is market price elasticity of demand also always lower than individual price elasticity of demand? Why or why not?
Three students have different demands for doughnuts. Andre’s demand is given by Q = 5 – P; Carlene’s demand is given by Q = 6 – 2P; Cooper’s demand is given by Q = 4 – 0.5P.
Derive the market demand curve for doughnuts algebraically.
Graph the market demand curve for doughnuts. Pay special attention to any kinks in the market demand!
Suppose that Grover consumes two goods, cookies and milk. Grover’s income expansion path is shown in the diagram below. Use the information in the diagram to explain whether each of the statements below is true or false. Provide an explanation for each answer.
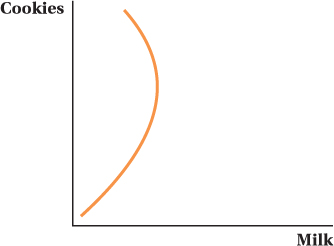
At low levels of income, both cookies and milk are normal goods for Grover.
As Grover’s income grows, eventually cookies become an inferior good.
Draw, intuitively, the Engel curve for Grover’s consumption of milk at various incomes.
Draw, intuitively, the Engel curve for Grover’s consumption of cookies at various incomes.
At a price of $3 each, Yoshi (a typical New Yorker) drinks 200 44-
ounce sodas each year. Concerned about burgeoning obesity, the mayor of New York proposes a $0.50 tax on such drinks. She then proposes compensating consumers for the price increase by mailing each resident a check for $100. What will happen to Yoshi’s consumption of soda? Show, using an indifference curve diagram with soda on the horizontal axis and a composite good (price = $1) on the vertical axis.
The implication of the optimal bundle is that Yoshi’s income is at least $600. In addition, assuming well-
behaved indifference curves implies that Yoshi’s income is greater than $600. As a result of the tax and the rebate, the intercepts in the two axes change. The intercept of the horizontal axis, after the tax and the rebate, lies to the left of Y/3. The intercept of the vertical axis, after the tax and the rebate, lies above Y. As shown in the graph below, Yoshi’s consumption of soda will decrease and his consumption of the composite good will increase. SB-
9 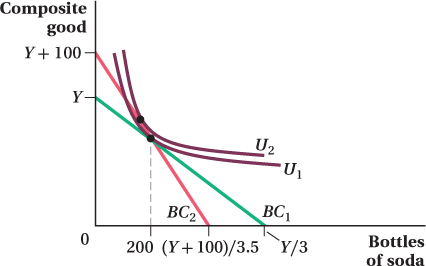
Will Yoshi be better off, worse off, or indifferent to the change? Explain, using your diagram.
Yoshi will be better off as his optimal bundle lies on a higher indifference curve than before.
In terms of revenue, will the government be better off, worse off, or indifferent to the proposal? Explain.
Since Yoshi cuts back on soda, the government raises less than $100 in revenue. At the same time, the government spends $100 subsidizing Yoshi. The government is therefore worse off.
 Work this problem with calculus