5.5 Combining Individual Demand Curves to Obtain the Market Demand Curve
When studying consumer demand, we’re often more interested in the combined demand of all consumers, rather than just one consumer’s demand. If a government wants to figure out how much revenue a tax on soda will raise, for example, it needs to look at the entire market demand for soda.
The market demand for a good is the sum of all the individual demand curves for it. That is, the market quantity demanded for a good at a particular price is the sum of every individual consumer’s quantity demanded at that price.
186
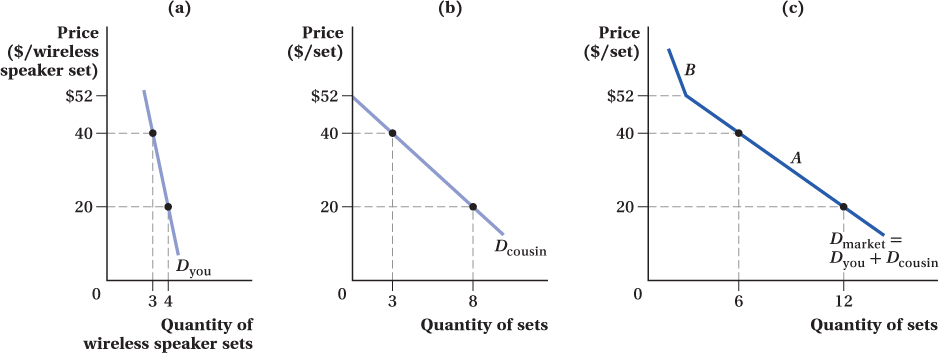
Figure 5.19 shows graphically how this adding up works. Suppose you and your cousin are the only two consumers in the market for sets of wireless speakers. The total market demand curve is obtained by summing horizontally each of the individual demand curves. For instance, at a price of $40, you and your cousin each want 3 sets of speakers, so the combined market quantity demanded is 6 sets. When the price is $20, you want 4 sets of speakers and your cousin wants 8, for a market quantity demanded of 12. Adding up the individual consumers’ quantities demanded at all possible prices gives the market demand curve.
The Market Demand Curve
There are a few things to notice about market demand curves. First, a market demand curve will never be to the left of any individual demand curve, because all consumers combined must consume at least as much of a good at a given price as any single consumer does. For a similar reason, the slope of the market demand curve must also be as flat as, or flatter than, any of the individual demand curves. That is, for a given change in price, the change in quantity demanded for the market as a whole must be at least as great as the change in quantity demanded by any individual consumer.8 Finally, if the price is so high that only one consumer wants any of the good, the individual demand curve for that consumer will lie directly on top of the market demand curve at that price. At that point, the consumer is the market.
187
Using Algebra to Move from Individual to Market Demand
We can move from individual to market demand algebraically as well as graphically. The formulas for the two demand curves in Figure 5.19 are
Qyou = 5 – 0.05P
Qcousin = 13 – 0.25P
To find the market demand for the speakers, we start by adding up the two individual demand curves:
Qmarket = Qyou + Qcousin = (5 – 0.05P) + (13 – 0.25P)
Qmarket = 18 – 0.3P
If we plug in the prices from Figure 5.19, they match the quantities in the figure as long as we are on the part of the curve labeled A in Figure 5.19 where quantities demanded by both you and your cousin are above zero. According to the equation, market demand when P = $40 is Qmarket = 6, which is what the figure shows, and when P = $20, Qmarket = 12, just as on the figure.
We’re not quite done yet, though. The prices at which you and your cousin will consume no speakers—
make the grade
Adding demand curves horizontally, not vertically
Moving from individual demand curves to market demand is conceptually fairly simple. There’s just one thing you have to be careful about. Market demand curves are derived by adding quantities of individual demand curves, not prices. That is, individual demands are graphically added horizontally, not vertically.
When you add horizontally, you are summing up all the individual quantities demanded, holding price fixed. This is exactly what you want to do because market demand is the total quantity demanded at any given price. If you add individual demand curves vertically, however, you are holding quantities demanded fixed while adding up the prices. That’s a very different conceptual exercise and one that, in this case at least, doesn’t really make any sense.
Likewise, if you are combining individual demand curves algebraically rather than graphically, make sure you’ve written out the individual demand curves as quantities demanded as a function of price. When you add those equations, you’ll just be adding the quantities, which is again what you want to do. If you instead try to add equations where prices are a function of quantities (economists call these “inverse demand curves”), again you’ll be doing the very different exercise of adding up prices across individuals while holding the quantities fixed.
188
figure it out 5.4
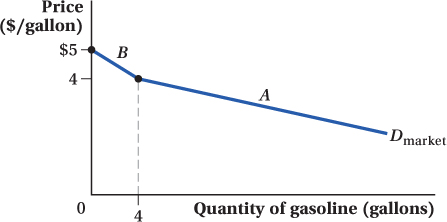
Suppose that at a rural gas station in Toby Acres, there are only two customers, Johnny (who drives a 4 × 4 pickup) and Olivia (who drives a Prius). Johnny’s demand for gasoline is QJ = 32 – 8P, while Olivia’s demand is QO = 20 – 4P, where Q is measured in gallons and P is the price per gallon.
Solve for the market demand equation for gasoline at Toby Acres.
Draw a diagram showing the market demand curve for gasoline at Toby Acres.
Solution:
The market demand curve is the horizontal sum of the buyers’ demand curves. Remember that summing horizontally means adding up quantities demanded at each price. This means that we can get the market demand by adding QJ and QO:
Qmarket = QJ + QO
= (32 – 8P) + (20 – 4P)
= 52 – 12P
But there is more to the story than solving for the summation of the two demand curves. Johnny is not willing to buy any gas if the price is greater than or equal to $4 per gallon because that is his demand choke price:
QJ = 32 – 8P
0 = 32 – 8P
8P = 32
P = $4
So, once the price hits $4, only Olivia will be in the market. Her demand choke price is $5:
QO = 20 – 4P
0 = 20 – 4P
4P = 20
P = $5
Thus, as long as the price is below $4 per gallon, the market demand for gasoline is the horizontal sum of the two buyers’ demand curves. Between a price of $4 and $5, the market demand is simply the same as Olivia’s demand. At a price greater than or equal to $5, quantity demanded is zero.
The figure here shows the market demand for gasoline in Toby Acres. Notice that the market demand curve is kinked as a result of the buyers’ different choke prices. Segment A is the section of demand below the price of $4 and is the horizontal summation of Johnny’s and Olivia’s demand for gasoline. Segment B is the segment of market demand where Olivia is the only buyer (since the price is above Johnny’s demand choke price). At a price of $5 or above, quantity demanded is zero.