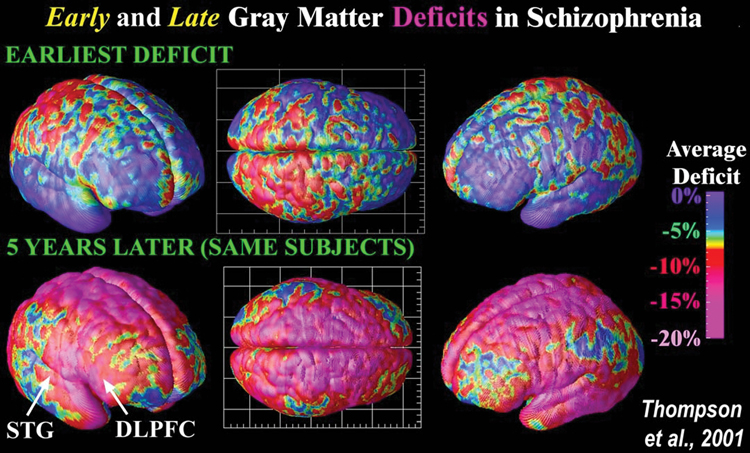
Figure 16.7 Mapping brain changes in schizophrenia Derived from MRI scans, these images were created after repeatedly scanning 12 subjects with schizophrenia over 5 years and comparing them with 12 matched healthy controls, scanned at the same ages and intervals. Severe loss of gray matter is indicated by red and pink colors, while stable regions are in blue. STG denotes the superior temporal gyrus, and DLPFC denotes the dorsolateral prefrontal cortex.
With permission from Thompson, P. M., Vidal, C., Giedd, J. N., et al. (2001). Proceedings of the National Academy of Sciences of the USA, 98, 11650–11655.