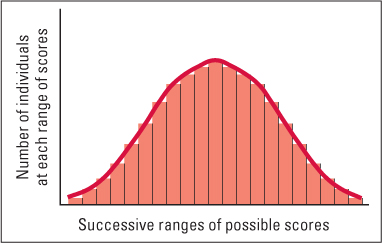
Figure 3.8 Normal distribution When many individuals are tested for a polygenic characteristic, the majority usually fall in the middle of the range of scores and the frequency tapers off toward zero at the extremes. Mathematically, this defines a normal curve. (For a more complete description, see the Statistical Appendix at the end of the book.)