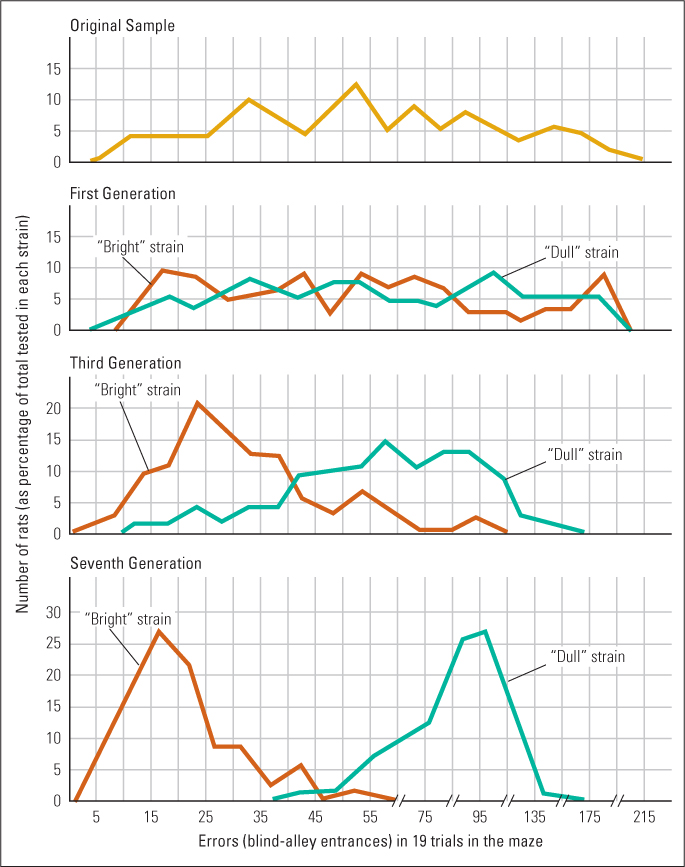
Figure 3.9 Selective breeding for “maze brightness” and “maze dullness” in rats The top graph shows, for the original parent stock, the distribution of rats according to the number of errors they made in the maze. Subsequent graphs show this distribution separately for the rats bred to be “bright” or “dull.” With successive generations of selective breeding, an increasing percentage in the “bright” strain made few errors and an increasing percentage in the “dull” strain made many errors.
(Based on data from Tryon, 1942.)