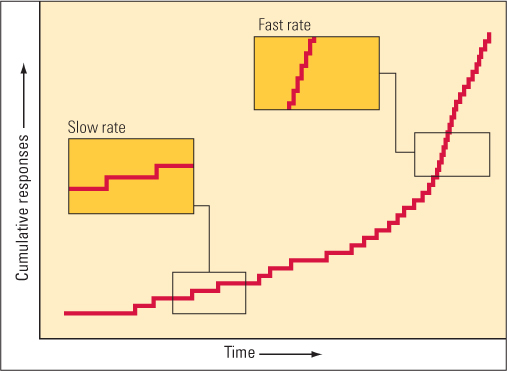
Figure 4.11 Typical cumulative response curve for a rat learning to press a lever in a Skinner box This graph is called a cumulative response curve because the height of the curve at any point indicates the total (cumulative) number of responses that the rat has made up to that time. The graph is automatically produced, while the rat is responding, by a recording machine outside the Skinner box. A pen moves horizontally across a roll of paper at a constant rate, and each lever press made by the rat produces a slight vertical movement of the pen. Thus, the degree to which the curve slopes upward is a measure of the animal’s response rate. Note that early in learning the response rate was very low and then gradually increased to a fast, steady rate.