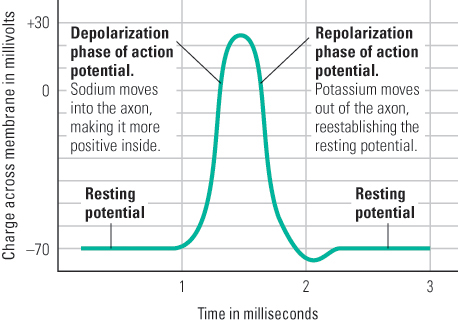
Figure 5.6
Electrical change during an action potential
This graph depicts the change, with time, in the electrical charge across a given point on the axon membrane as an action potential passes through that point.
Next