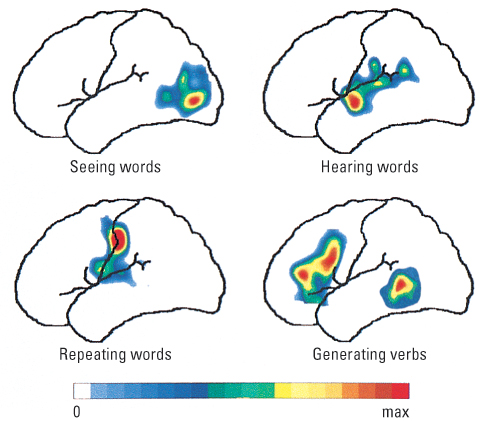
Figure 5.33 Brain activity during word-processing tasks, as revealed by PET Each figure shows the amount of activity in each part of the left hemisphere during the performance of the indicated task, relative to the amount of activity in that part during the performance of the task one level below it in the hierarchy. The colors violet, blue, green, yellow, and red, in that order, represent increasing amounts of activity.
Washington University, Mallinckrodt Institute of Radiology