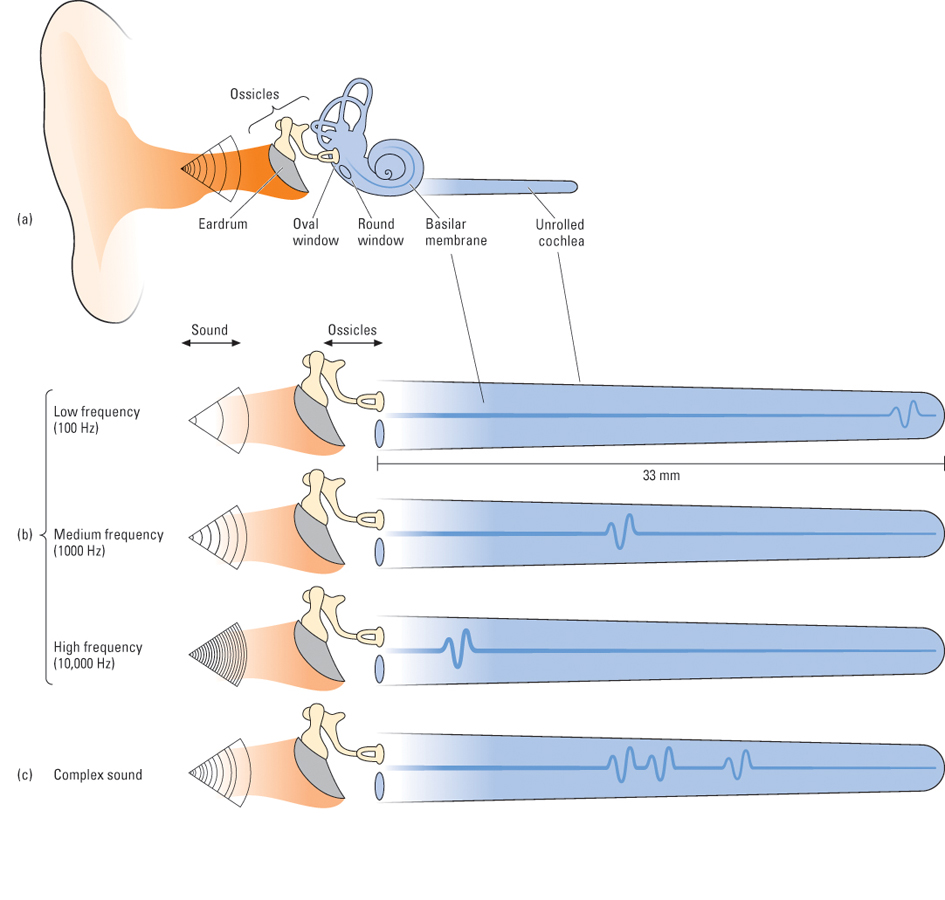
Figure 7.15 Waves on the basilar membrane In this highly schematic diagram, the cochlea is uncoiled and stretched out and the basilar membrane is depicted as a line running down the center of the cochlea. Part (b) depicts the back-and-forth movement of the ossicles in response to sound and the traveling wave that that motion sets up on the basilar membrane. The separate parts of (b) illustrate the relationship between the frequency of a tone and the site on the basilar membrane where the traveling wave reaches its peak amplitude. Part (c) shows that a complex sound (that is, a sound made up of more than one frequency) produces wave peaks simultaneously at more than one location on the basilar membrane. The sizes of the wave peaks are greatly exaggerated in the diagram. The waves are shown only at the places where they peak. In fact, each wave must travel the length of the basilar membrane to the site where it reaches its peak. It dies out shortly after that.
(Adapted from Hudspeth, 2000a.)