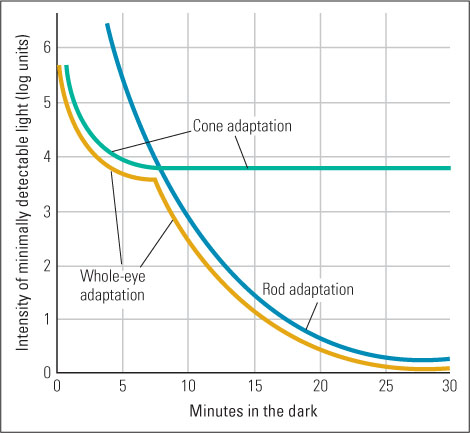
Figure 8.5 Dark-adaptation curves The yellow curve depicts the minimal intensity of a spot of light that a person with normal vision can see after varying periods in the dark after having been in bright light. The lower the curve, the greater the sensitivity to light. For the first 7 minutes or so, the cones are more sensitive than the rods, but after that the rods are more sensitive. The two-part nature of the curve can be understood by comparing it to the dark-adaptation curve obtained for a person who has only rods (the blue curve) and to that obtained if the light is presented in such a way that it strikes just the fovea, where only cones exist (the green curve).
(Based on data from Grusser & Grusser-Cornehls, 1986.)