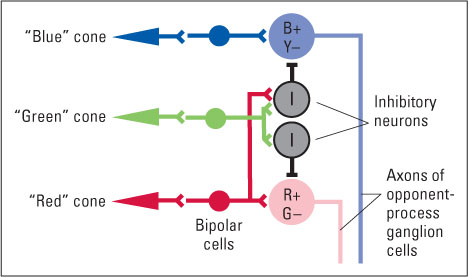
Figure 8.10 Reconciliation of the trichromatic and opponent-process theories Shown here is a schematic diagram illustrating how connections from the three types of cones can result in opponent-process cells—cells that are excited by blue and inhibited by yellow (B+Y-) and cells that are excited by red and inhibited by green (R+G-). Excitatory neural connections are shown as Y-shaped axonal endings, and inhibitory connections are shown as straight lines perpendicular to the axon. The cells marked “I” are inhibitory intermediary neurons. As an exercise, try constructing diagrams that would produce B-Y+ and R-G+ opponent neurons.