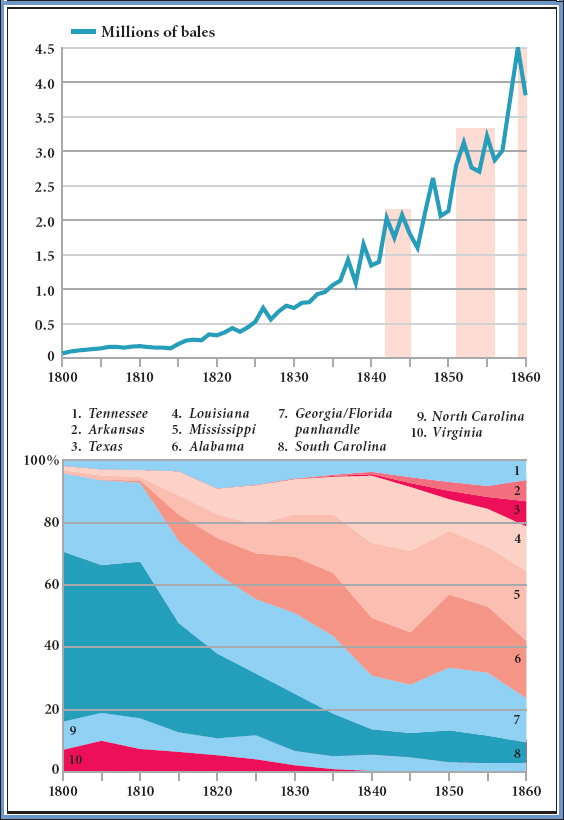
FIGURE 12.1 Cotton Production and Producers, 1800–1860
Until 1820, Georgia and South Carolina plantations (marked #7 and #8 on the right side of the lower graph) grew more than one-half of American cotton. As output increased significantly between 1820 and 1840 (see the upper graph), the locus of production shifted. By the early 1840s, planters had moved hundreds of thousands of slaves to the Mississippi Valley, and Louisiana, Mississippi, and Alabama (#4, #5, and #6) grew nearly 70 percent of a much larger cotton crop. Simultaneously, production leapt dramatically, reaching (as the red bars show) 2 million bales a year by the mid-1840s, 3 million by the mid-1850s, and 4 million on the eve of the Civil War. Source: From Time on the Cross: The Economics of American Negro Slavery, by Robert W. Fogel and Stanley L. Engerman. Copyright © 1974 Little Brown.